Netgear WGX102 WGX102v2 Reference Manual - Page 60
Access Point Statistics screen, Table 6-3
 |
View all Netgear WGX102 manuals
Add to My Manuals
Save this manual to your list of manuals |
Page 60 highlights
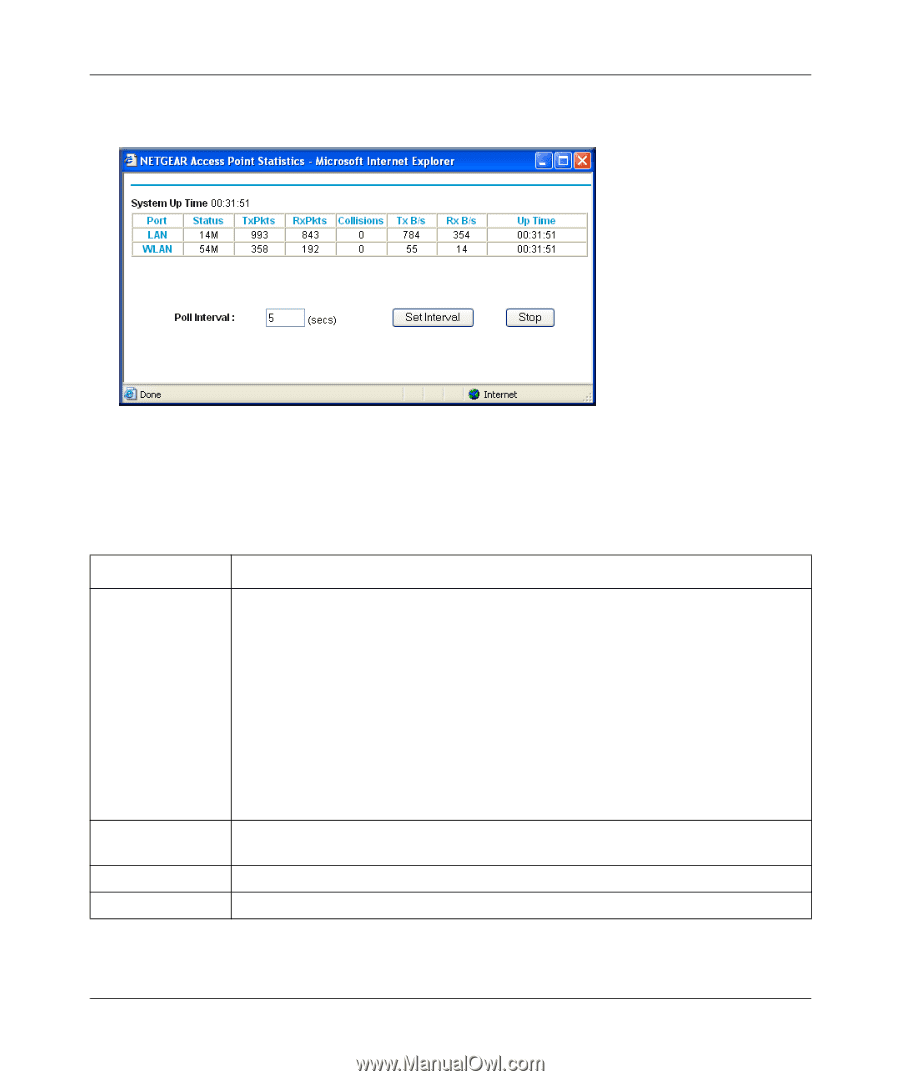
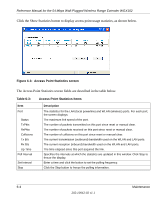
Reference Manual for the 54 Mbps Wall-Plugged Wireless Range Extender WGX102 Click the Show Statistics button to display access point usage statistics, as shown below. Figure 6-3: Access Point Statistics screen The Access Point Statistics screen fields are described in the table below: Table 6-3: Access Point Statistics Items Item Port Status TxPkts RxPkts Collisions Tx B/s Rx B/s Up Time Poll Interval Set Interval Stop Description The statistics for the LAN (local powerline) and WLAN (wireless) ports. For each port, the screen displays: The maximum link speed of the port. The number of packets transmitted on this port since reset or manual clear. The number of packets received on this port since reset or manual clear. The number of collisions on this port since reset or manual clear. The current transmission (outbound) bandwidth used on the WLAN and LAN ports. The current reception (inbound) bandwidth used on the WLAN and LAN ports. The time elapsed since this port acquired the link. Specifies the intervals at which the statistics are updated in this window. Click Stop to freeze the display. Enter a time and click the button to set the polling frequency. Click the Stop button to freeze the polling information. 6-4 Maintenance 202-10042-02 v1.1
-
 1
1 -
2
-
3
-
4
-
5
-
6
-
7
-
8
-
9
-
10
-
11
-
12
-
13
-
14
-
15
-
16
-
17
-
18
-
19
-
20
-
21
-
22
-
23
-
24
-
25
-
26
-
27
-
28
-
29
-
30
-
31
-
32
-
33
-
34
-
35
-
36
-
37
-
38
-
39
-
40
-
41
-
42
-
43
-
44
-
45
-
46
-
47
-
48
-
49
-
50
-
51
-
52
-
53
-
54
-
 55
55 -
 56
56 -
 57
57 -
 58
58 -
 59
59 -
 60
60 -
 61
61 -
 62
62 -
 63
63 -
 64
64 -
 65
65 -
66
-
67
-
68
-
69
-
70
-
71
-
72
-
73
-
74
-
75
-
76
-
77
-
78
-
79
-
80
-
81
-
82
-
83
-
84
-
85
-
86
-
87
-
88
-
89
-
90
-
91
-
92
-
93
-
94
-
95
-
96
-
97
-
98
-
99
-
100
-
101
-
102
-
103
-
104
-
105
-
106
-
107
-
108
-
109
-
110
-
111
-
112
-
113
-
114
-
115
-
116
-
117
-
118
-
119
-
120
-
121
-
122
-
123
-
124
-
125
-
126
-
127
-
128
-
129
-
130
-
131
-
132
-
133
-
134
-
135
-
136
-
137
-
138
-
139
-
140
-
141
-
142
-
143
-
144
-
145
-
146
-
147
-
148
-
149
-
150
-
151
-
152
-
153
-
154
-
155
-
156
-
157
-
158
-
159
-
160
-
161
-
162
-
163
-
164
-
165
-
166
-
167
-
168
-
169
 |
 |