Intel 2011B Configuration Guide - Page 29
The Connection Quality Test Screen
 |
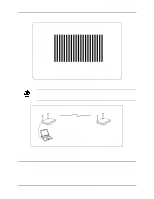
UPC - 735858150187
View all Intel 2011B manuals
Add to My Manuals
Save this manual to your list of manuals |
Page 29 highlights
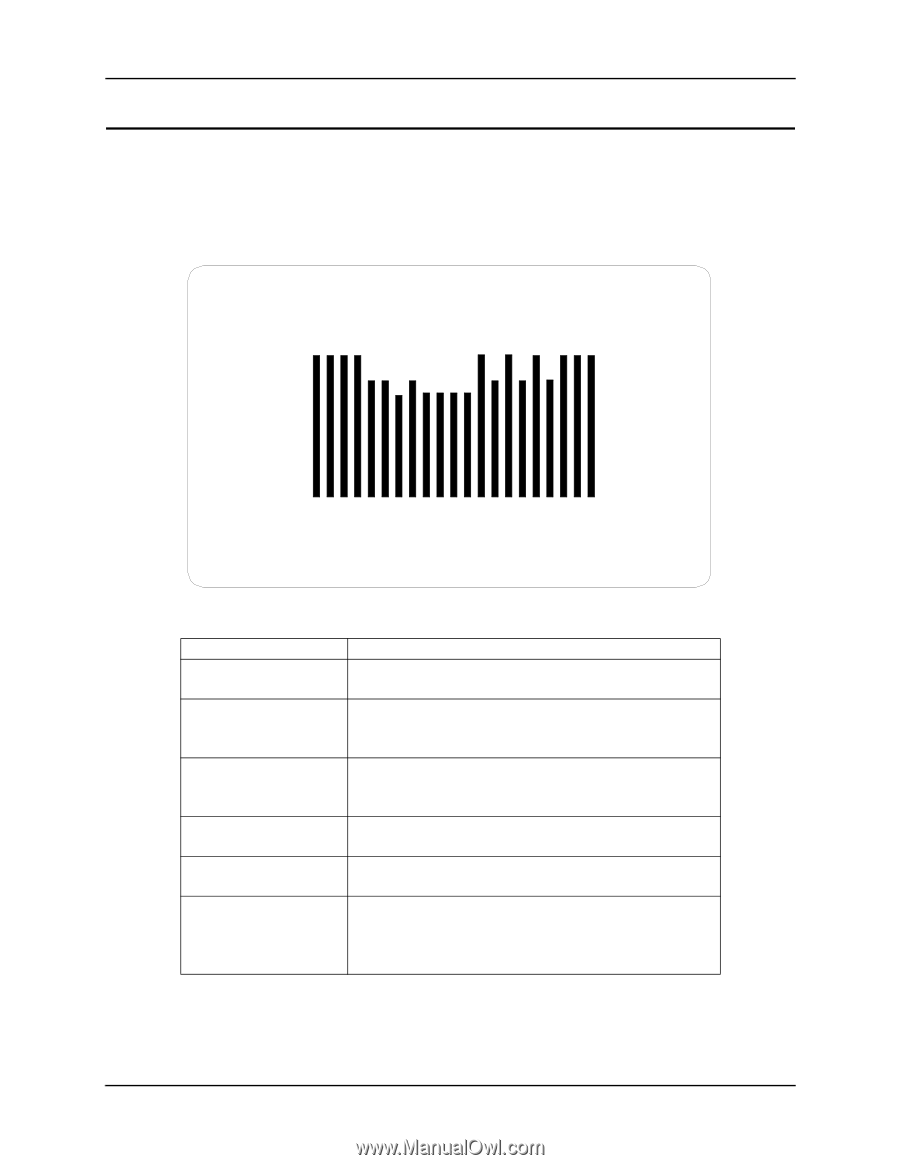
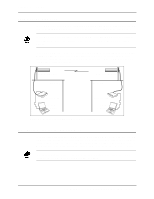
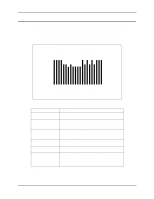
Chapter 6. RF Link Test 6.2 The Connection Quality Test Screen During the RF Link Test, the local access point sends Wireless Network Maintenance Protocol (WNMP) packets once every second, and the signal quality of each reply is displayed on the Connection Quality Test screen. An example is shown in Figure 6-2. Descriptions of the items displayed on the Connection Quality Test screen are listed in Table 6-1. Local Access Point Connection Quality Test Remote Device MAC Address: 00:A0:F8:94:C2:04 max | | | | Signal | Quality | | | | min | Tx Rate 11 Mb/s Tx Retries 1 Rx Rate 11 Mb/s RSSI 22 Exit-[ESC] Figure 6-2: Example of Connection Quality Test Screen Item Remote Device MAC Address Signal Quality Tx Rate Rx Rate Tx Retries RSSI Definition MAC address of the remote access point that has a wireless access point link to the local access point. Displayed as vertical bars. Each bar is the signal quality, or strength, of each reply received from the remote access point. The higher the bar, the better the signal quality. Shows the transmitted data rate of the local access point in Megabits per second Mbps. One of four rates may be displayed: 11, 5.5, 2, or 1 Mbps. Received data rate from remote access point in Mbps. One of four rates may be displayed: 11, 5.5, 2, or 1 Mbps. Number of times packets are retransmitted from the local access point. Received Signal Strength Indicator. Indicates the current signal strength of the signal received from the remote access point. The maximum RSSI value for this test is 31; although, the RSSI scale during normal operation goes up to 255. Table 6-1: Definitions of Connection Quality Test Screen Configuring Access Point Bridging and Repeating (WLAP Mode) 23
-
 1
1 -
2
-
3
-
4
-
5
-
6
-
7
-
8
-
9
-
10
-
11
-
12
-
13
-
14
-
15
-
16
-
17
-
18
-
19
-
20
-
21
-
22
-
23
-
 24
24 -
 25
25 -
 26
26 -
 27
27 -
 28
28 -
 29
29 -
 30
30 -
 31
31 -
 32
32 -
 33
33 -
 34
34 -
35
-
36
-
37
-
38
-
39
-
40
-
41
-
42
-
43
-
44
 |
 |