Lantronix PremierWave XC PremierWave XC - User Guide - Page 80
Processes, To View Process Information, Using Web Manager, Using the CLI, Using XML, Route, To View
 |
View all Lantronix PremierWave XC manuals
Add to My Manuals
Save this manual to your list of manuals |
Page 80 highlights
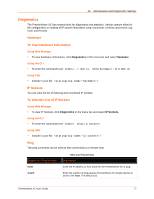
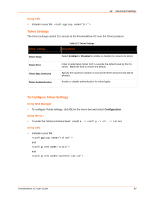
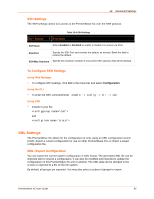
11: Maintenance and Diagnostics Settings Processes The PremierWave XC Processes information shows all the processes currently running on the system. It shows the Process ID (PID), Parent Process ID (PPID), user, CPU percentage, percentage of total CPU cycles, and process command line information. To View Process Information Using Web Manager To view process information, click Diagnostics in the menu bar and select Processes. Using the CLI To enter the command level: enable, show processes Using XML Include in your file: Route The PremierWave XC Route information shows the system's routing table, which includes Destination, Gateway, Genmask, Flag, Metric, Ref, Use and Interface. To View Route Information Using Web Manager To view the routing table information, click Diagnostics in the menu bar and select Route. Using the CLI To enter the command level: enable, route Threads The PremierWave XC Threads information shows the Thread ID (TID), Thread Name and CPU Usage for the various system threads. To View Threads Information Using Web Manager To view system's threads information, click Diagnostics in the menu bar and select Threads. PremierWave XC User Guide 80
-
 1
1 -
2
-
3
-
4
-
5
-
6
-
7
-
8
-
9
-
10
-
11
-
12
-
13
-
14
-
15
-
16
-
17
-
18
-
19
-
20
-
21
-
22
-
23
-
24
-
25
-
26
-
27
-
28
-
29
-
30
-
31
-
32
-
33
-
34
-
35
-
36
-
37
-
38
-
39
-
40
-
41
-
42
-
43
-
44
-
45
-
46
-
47
-
48
-
49
-
50
-
51
-
52
-
53
-
54
-
55
-
56
-
57
-
58
-
59
-
60
-
61
-
62
-
63
-
64
-
65
-
66
-
67
-
68
-
69
-
70
-
71
-
72
-
73
-
74
-
 75
75 -
 76
76 -
 77
77 -
 78
78 -
 79
79 -
 80
80 -
 81
81 -
 82
82 -
 83
83 -
 84
84 -
 85
85 -
86
-
87
-
88
-
89
-
90
-
91
-
92
-
93
-
94
-
95
-
96
-
97
-
98
-
99
-
100
-
101
-
102
-
103
-
104
-
105
-
106
-
107
-
108
-
109
 |
 |
