Lenovo ThinkServer RD240 Hardware Maintenance Manual - Page 37
System event log, Diagnostic LEDs on the front control panel, Onboard debug digitron
 |
View all Lenovo ThinkServer RD240 manuals
Add to My Manuals
Save this manual to your list of manuals |
Page 37 highlights
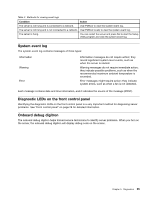
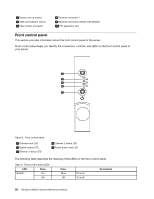
Table 3. Methods for viewing event logs Condition Action The server is not hung and is connected to a network. Use IPMItool to view the system-event log. The server is not hung and is not connected to a network. Use IPMItool locally to view the system-event log. The server is hung. You can restart the server and press Del to start the Setup Utility program and view the system-event log. System event log The system-event log contains messages of three types: Information Warning Error Information messages do not require action; they record significant system-level events, such as when the server is started. Warning messages do not require immediate action; they indicate possible problems, such as when the recommended maximum ambient temperature is exceeded. Error messages might require action; they indicate system errors, such as when a fan is not detected. Each message contains date and time information, and it indicates the source of the message (POST). Diagnostic LEDs on the front control panel Identifying the diagnostic LEDs on the front control panel is a very important method for diagnosing server problems. See "Front control panel" on page 28 for detailed information. Onboard debug digitron The onboard debug digitron helps trained service technicians to identify server problems. When you turn on the server, the onboard debug digitron will display debug code on the screen. Chapter 5. Diagnostics 25
-
 1
1 -
2
-
3
-
4
-
5
-
6
-
7
-
8
-
9
-
10
-
11
-
12
-
13
-
14
-
15
-
16
-
17
-
18
-
19
-
20
-
21
-
22
-
23
-
24
-
25
-
26
-
27
-
28
-
29
-
30
-
31
-
 32
32 -
 33
33 -
 34
34 -
 35
35 -
 36
36 -
 37
37 -
 38
38 -
 39
39 -
 40
40 -
 41
41 -
 42
42 -
43
-
44
-
45
-
46
-
47
-
48
-
49
-
50
-
51
-
52
-
53
-
54
-
55
-
56
-
57
-
58
-
59
-
60
-
61
-
62
-
63
-
64
-
65
-
66
-
67
-
68
-
69
-
70
-
71
-
72
-
73
-
74
-
75
-
76
-
77
-
78
-
79
-
80
-
81
-
82
-
83
-
84
-
85
-
86
-
87
-
88
-
89
-
90
-
91
-
92
-
93
-
94
-
95
-
96
-
97
-
98
-
99
-
100
-
101
-
102
-
103
-
104
-
105
-
106
-
107
-
108
-
109
-
110
-
111
-
112
-
113
-
114
-
115
-
116
-
117
-
118
-
119
-
120
-
121
-
122
-
123
-
124
-
125
-
126
-
127
-
128
-
129
-
130
-
131
-
132
-
133
-
134
-
135
-
136
-
137
-
138
-
139
-
140
-
141
-
142
-
143
-
144
-
145
-
146
-
147
-
148
-
149
-
150
-
151
-
152
-
153
-
154
-
155
-
156
-
157
-
158
-
159
-
160
-
161
-
162
-
163
-
164
-
165
-
166
 |
 |
