Lowrance HDS-7 Carbon Operators Manual EN - Page 40
Zooming a 3D chart, Chart overlay, Insight and C-MAP charts, Insight and C-MAP tides and currents
 |
View all Lowrance HDS-7 Carbon manuals
Add to My Manuals
Save this manual to your list of manuals |
Page 40 highlights
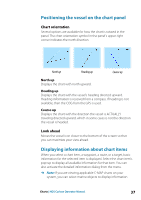
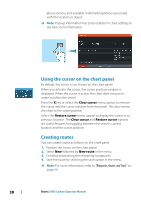
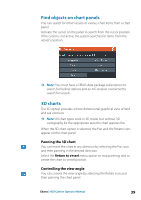
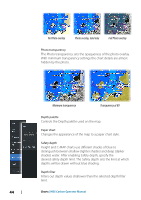
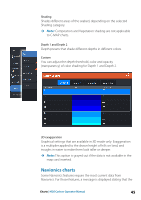
• To change the direction you are viewing, pan horizontally • To change the tilt angle of the view, pan vertically Ú Note: When centered on the vessel position, only the tilt angle can be adjusted. The view direction is controlled by the chart orientation setting. See "Positioning the vessel on the chart panel" on page 37. Zooming a 3D chart You zoom in and out on a 3D chart by using the zoom (+ or -) buttons, by using the + and - keys, or the touch method of pinching and spreading your fingers. Chart overlay Radar, structure, SonarChart Live (Navionics charts only) and weather data can be displayed as overlay on your chart panel. Ú Note: Weather overlay is currently only available in the United States. When an overlay is selected, the chart menu expands to include basic menu functions for the selected overlay. Radar, structure and weather functions are described in separate sections in this manual. For more information about SonarChart Live, see section "SonarChart Live" on page 46. Insight and C-MAP charts All possible menu options for Insight and C-MAP charts are described below. The features and menu options available can vary depending on the charts you use. This section shows menus from an Insight chart. Ú Note: A menu option is greyed out if it is not available on the chart displayed. For example, raster charts are not available with Insight, so the Raster charts menu option is greyed out when Insight charts are displayed. Insight and C-MAP tides and currents The system can display Insight and C-MAP tides and currents. With this information it is possible to predict the time, level, direction and 40 Charts | HDS Carbon Operator Manual
-
 1
1 -
2
-
3
-
4
-
5
-
6
-
7
-
8
-
9
-
10
-
11
-
12
-
13
-
14
-
15
-
16
-
17
-
18
-
19
-
20
-
21
-
22
-
23
-
24
-
25
-
26
-
27
-
28
-
29
-
30
-
31
-
32
-
33
-
34
-
 35
35 -
 36
36 -
 37
37 -
 38
38 -
 39
39 -
 40
40 -
 41
41 -
 42
42 -
 43
43 -
 44
44 -
 45
45 -
46
-
47
-
48
-
49
-
50
-
51
-
52
-
53
-
54
-
55
-
56
-
57
-
58
-
59
-
60
-
61
-
62
-
63
-
64
-
65
-
66
-
67
-
68
-
69
-
70
-
71
-
72
-
73
-
74
-
75
-
76
-
77
-
78
-
79
-
80
-
81
-
82
-
83
-
84
-
85
-
86
-
87
-
88
-
89
-
90
-
91
-
92
-
93
-
94
-
95
-
96
-
97
-
98
-
99
-
100
-
101
-
102
-
103
-
104
-
105
-
106
-
107
-
108
-
109
-
110
-
111
-
112
-
113
-
114
-
115
-
116
-
117
-
118
-
119
-
120
-
121
-
122
-
123
-
124
-
125
-
126
-
127
-
128
-
129
-
130
-
131
-
132
-
133
-
134
-
135
-
136
-
137
-
138
-
139
-
140
-
141
-
142
-
143
-
144
-
145
-
146
-
147
-
148
-
149
-
150
-
151
-
152
-
153
-
154
-
155
-
156
-
157
-
158
-
159
-
160
-
161
-
162
-
163
-
164
-
165
-
166
-
167
-
168
-
169
-
170
-
171
-
172
-
173
-
174
-
175
-
176
-
177
-
178
-
179
-
180
-
181
-
182
-
183
-
184
-
185
-
186
-
187
-
188
-
189
-
190
-
191
-
192
-
193
-
194
-
195
-
196
-
197
-
198
 |
 |
