Lowrance HDS-7 Carbon Operators Manual EN - Page 50
SC Density, Fishing range, Shallow water highlight
 |
View all Lowrance HDS-7 Carbon manuals
Add to My Manuals
Save this manual to your list of manuals |
Page 50 highlights
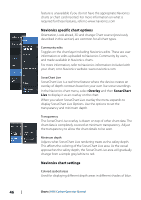
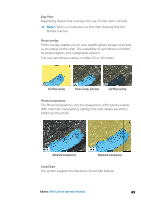
SonarChart displays a bathymetry map showing high resolution contour detail and standard navigational data. For more information, refer to www.navionics.com. SC Density Controls the density of the SonarChart and SonarChart Live contours. Fishing range Select a range of depths between which Navionics fills with a different color. This allows you to highlight a specific range of depths for fishing purposes. The range is only as accurate as the underlying chart data, meaning that if the chart only contains 5 meter intervals for contour lines, the shading is rounded to the nearest available contour line. No Depth highlight range Depth highlight range: 6 m - 12 m Shallow water highlight Highlights areas of shallow water. This allows you to highlight areas of water between 0 and the selected depth (up to 10 meters/30 feet). No shallow water highlighted Shallow water highlight: 0 m - 3 m 50 Charts | HDS Carbon Operator Manual
-
 1
1 -
2
-
3
-
4
-
5
-
6
-
7
-
8
-
9
-
10
-
11
-
12
-
13
-
14
-
15
-
16
-
17
-
18
-
19
-
20
-
21
-
22
-
23
-
24
-
25
-
26
-
27
-
28
-
29
-
30
-
31
-
32
-
33
-
34
-
35
-
36
-
37
-
38
-
39
-
40
-
41
-
42
-
43
-
44
-
 45
45 -
 46
46 -
 47
47 -
 48
48 -
 49
49 -
 50
50 -
 51
51 -
 52
52 -
 53
53 -
 54
54 -
 55
55 -
56
-
57
-
58
-
59
-
60
-
61
-
62
-
63
-
64
-
65
-
66
-
67
-
68
-
69
-
70
-
71
-
72
-
73
-
74
-
75
-
76
-
77
-
78
-
79
-
80
-
81
-
82
-
83
-
84
-
85
-
86
-
87
-
88
-
89
-
90
-
91
-
92
-
93
-
94
-
95
-
96
-
97
-
98
-
99
-
100
-
101
-
102
-
103
-
104
-
105
-
106
-
107
-
108
-
109
-
110
-
111
-
112
-
113
-
114
-
115
-
116
-
117
-
118
-
119
-
120
-
121
-
122
-
123
-
124
-
125
-
126
-
127
-
128
-
129
-
130
-
131
-
132
-
133
-
134
-
135
-
136
-
137
-
138
-
139
-
140
-
141
-
142
-
143
-
144
-
145
-
146
-
147
-
148
-
149
-
150
-
151
-
152
-
153
-
154
-
155
-
156
-
157
-
158
-
159
-
160
-
161
-
162
-
163
-
164
-
165
-
166
-
167
-
168
-
169
-
170
-
171
-
172
-
173
-
174
-
175
-
176
-
177
-
178
-
179
-
180
-
181
-
182
-
183
-
184
-
185
-
186
-
187
-
188
-
189
-
190
-
191
-
192
-
193
-
194
-
195
-
196
-
197
-
198
 |
 |
