Lowrance HDS-7 Carbon Operators Manual EN - Page 46
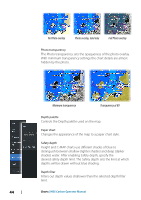
Navionics specific chart options, Community edits, SonarChart Live, Transparency, Minimum depth
 |
View all Lowrance HDS-7 Carbon manuals
Add to My Manuals
Save this manual to your list of manuals |
Page 46 highlights
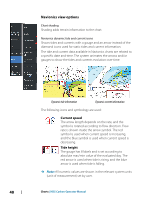
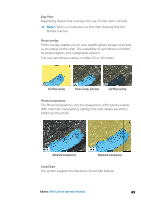
feature is unavailable if you do not have the appropriate Navionics charts or chart card inserted. For more information on what is required for these features, refer to www.navionics.com Navionics specific chart options Orientation, Look ahead, 3D and change Chart source (previously described in this section) are common for all chart types. Community edits Toggles on the chart layer including Navionics edits. These are user information or edits uploaded to Navionics Community by users, and made available in Navionics charts. For more information, refer to Navionics information included with your chart, or to Navionics website: www.navionics.com. SonarChart Live SonarChart Live is a real-time feature where the device creates an overlay of depth contours based on your own live sonar soundings. In the Navionics chart menu, select Overlay and then SonarChart Live to display it as an overlay on the chart. When you select SonarChart Live overlay the menu expands to display SonarChart Live Options. Use the options to set the transparency and minimum depth. Transparency The SonarChart Live overlay is drawn on top of other chart data. The chart data is completely covered at minimum transparency. Adjust the transparency to allow the chart details to be seen. Minimum depth Adjusts what SonarChart Live rendering treats as the safety depth. This affects the coloring of the SonarChart Live area. As the vessel approaches the safety depth, the SonarChart Live area will gradually change from a simple grey/white to red. Navionics chart settings Colored seabed areas Used for displaying different depth areas in different shades of blue. 46 Charts | HDS Carbon Operator Manual
-
 1
1 -
2
-
3
-
4
-
5
-
6
-
7
-
8
-
9
-
10
-
11
-
12
-
13
-
14
-
15
-
16
-
17
-
18
-
19
-
20
-
21
-
22
-
23
-
24
-
25
-
26
-
27
-
28
-
29
-
30
-
31
-
32
-
33
-
34
-
35
-
36
-
37
-
38
-
39
-
40
-
 41
41 -
 42
42 -
 43
43 -
 44
44 -
 45
45 -
 46
46 -
 47
47 -
 48
48 -
 49
49 -
 50
50 -
 51
51 -
52
-
53
-
54
-
55
-
56
-
57
-
58
-
59
-
60
-
61
-
62
-
63
-
64
-
65
-
66
-
67
-
68
-
69
-
70
-
71
-
72
-
73
-
74
-
75
-
76
-
77
-
78
-
79
-
80
-
81
-
82
-
83
-
84
-
85
-
86
-
87
-
88
-
89
-
90
-
91
-
92
-
93
-
94
-
95
-
96
-
97
-
98
-
99
-
100
-
101
-
102
-
103
-
104
-
105
-
106
-
107
-
108
-
109
-
110
-
111
-
112
-
113
-
114
-
115
-
116
-
117
-
118
-
119
-
120
-
121
-
122
-
123
-
124
-
125
-
126
-
127
-
128
-
129
-
130
-
131
-
132
-
133
-
134
-
135
-
136
-
137
-
138
-
139
-
140
-
141
-
142
-
143
-
144
-
145
-
146
-
147
-
148
-
149
-
150
-
151
-
152
-
153
-
154
-
155
-
156
-
157
-
158
-
159
-
160
-
161
-
162
-
163
-
164
-
165
-
166
-
167
-
168
-
169
-
170
-
171
-
172
-
173
-
174
-
175
-
176
-
177
-
178
-
179
-
180
-
181
-
182
-
183
-
184
-
185
-
186
-
187
-
188
-
189
-
190
-
191
-
192
-
193
-
194
-
195
-
196
-
197
-
198
 |
 |
