Netgear R8900 User Manual - Page 80

Display Internet Port Statistics, Manage Your Network, Nighthawk X10 AD7000 Smart WiFi Router

Page 80 highlights

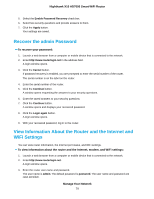
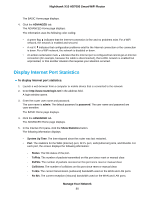
Nighthawk X10 AD7000 Smart WiFi Router The BASIC Home page displays. 4. Click the ADVANCED tab. The ADVANCED Home page displays. The information uses the following color coding: • A green flag indicates that the Internet connection is fine and no problems exist. For a WiFi network, the network is enabled and secured. • A red X indicates that configuration problems exist for the Internet connection or the connection is down. For a WiFi network, the network is disabled or down. • An amber exclamation mark indicates that the Internet port is configured but cannot get an Internet connection (for example, because the cable is disconnected), that a WiFi network is enabled but unprotected, or that another situation that requires your attention occurred. Display Internet Port Statistics To display Internet port statistics: 1. Launch a web browser from a computer or mobile device that is connected to the network. 2. Enter http://www.routerlogin.net in the address field. A login window opens. 3. Enter the router user name and password. The user name is admin. The default password is password. The user name and password are case-sensitive. The BASIC Home page displays. 4. Click the ADVANCED tab. The ADVANCED Home page displays. 5. In the Internet Port pane, click the Show Statistics button. The following information displays: • System Up Time. The time elapsed since the router was last restarted. • Port. The statistics for the WAN (Internet) port, SFP+ port, LAN (Ethernet) ports, and WLANs. For each port, the screen displays the following information: - Status. The link status of the port. - TxPkts. The number of packets transmitted on this port since reset or manual clear. - RxPkts. The number of packets received on this port since reset or manual clear. - Collisions. The number of collisions on this port since reset or manual clear. - Tx B/s. The current transmission (outbound) bandwidth used on the WAN and LAN ports. - Rx B/s. The current reception (inbound) bandwidth used on the WAN and LAN ports. Manage Your Network 80

  • 1
  • 2
  • 3
  • 4
  • 5
  • 6
  • 7
  • 8
  • 9
  • 10
  • 11
  • 12
  • 13
  • 14
  • 15
  • 16
  • 17
  • 18
  • 19
  • 20
  • 21
  • 22
  • 23
  • 24
  • 25
  • 26
  • 27
  • 28
  • 29
  • 30
  • 31
  • 32
  • 33
  • 34
  • 35
  • 36
  • 37
  • 38
  • 39
  • 40
  • 41
  • 42
  • 43
  • 44
  • 45
  • 46
  • 47
  • 48
  • 49
  • 50
  • 51
  • 52
  • 53
  • 54
  • 55
  • 56
  • 57
  • 58
  • 59
  • 60
  • 61
  • 62
  • 63
  • 64
  • 65
  • 66
  • 67
  • 68
  • 69
  • 70
  • 71
  • 72
  • 73
  • 74
  • 75
  • 76
  • 77
  • 78
  • 79
  • 80
  • 81
  • 82
  • 83
  • 84
  • 85
  • 86
  • 87
  • 88
  • 89
  • 90
  • 91
  • 92
  • 93
  • 94
  • 95
  • 96
  • 97
  • 98
  • 99
  • 100
  • 101
  • 102
  • 103
  • 104
  • 105
  • 106
  • 107
  • 108
  • 109
  • 110
  • 111
  • 112
  • 113
  • 114
  • 115
  • 116
  • 117
  • 118
  • 119
  • 120
  • 121
  • 122
  • 123
  • 124
  • 125
  • 126
  • 127
  • 128
  • 129
  • 130
  • 131
  • 132
  • 133
  • 134
  • 135
  • 136
  • 137
  • 138
  • 139
  • 140
  • 141
  • 142
  • 143
  • 144
  • 145
  • 146
  • 147
  • 148
  • 149
  • 150
  • 151
  • 152
  • 153
  • 154
  • 155

The BASIC Home page displays.
4.
Click the
ADVANCED
tab.
The ADVANCED Home page displays.
The information uses the following color coding:
A green flag
indicates that the Internet connection is fine and no problems exist. For a WiFi
network, the network is enabled and secured.
A red X
indicates that configuration problems exist for the Internet connection or the connection
is down. For a WiFi network, the network is disabled or down.
An amber exclamation mark
indicates that the Internet port is configured but cannot get an Internet
connection (for example, because the cable is disconnected), that a WiFi network is enabled but
unprotected, or that another situation that requires your attention occurred.
Display Internet Port Statistics
To display Internet port statistics:
1.
Launch a web browser from a computer or mobile device that is connected to the network.
2.
Enter
in the address field.
A login window opens.
3.
Enter the router user name and password.
The user name is
admin
. The default password is
password
. The user name and password are
case-sensitive.
The BASIC Home page displays.
4.
Click the
ADVANCED
tab.
The ADVANCED Home page displays.
5.
In the Internet Port pane, click the
Show Statistics
button.
The following information displays:
System Up Time
. The time elapsed since the router was last restarted.
Port
. The statistics for the WAN (Internet) port, SFP+ port, LAN (Ethernet) ports, and WLANs. For
each port, the screen displays the following information:
-
Status
. The link status of the port.
-
TxPkts
. The number of packets transmitted on this port since reset or manual clear.
-
RxPkts
.The number of packets received on this port since reset or manual clear.
-
Collisions
. The number of collisions on this port since reset or manual clear.
-
Tx B/s
. The current transmission (outbound) bandwidth used on the WAN and LAN ports.
-
Rx B/s
. The current reception (inbound) bandwidth used on the WAN and LAN ports.
Manage Your Network
80
Nighthawk X10 AD7000 Smart WiFi Router