TP-Link Auranet EAP120 EAP Controller Software V2 User Guide - Page 20
View Current Usage-Top APs, View Recent Activities
 |
View all TP-Link Auranet EAP120 manuals
Add to My Manuals
Save this manual to your list of manuals |
Page 20 highlights
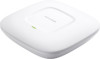
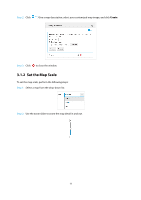
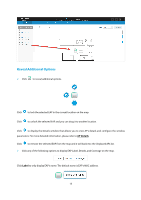
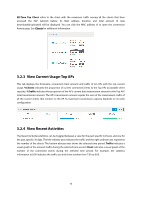
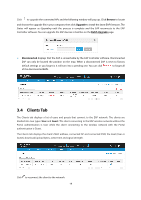
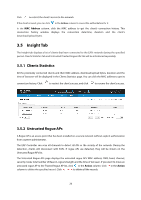
All-Time Top Client refers to the client with the maximum traffic among all the clients that have accessed the EAP network before. Its MAC address, duration and total amount of data downloaded/uploaded will be displayed. You can click the MAC address of to open the connection history page. See Clients for additional information. 3.2.3 View Current Usage-Top APs This tab displays the hostname, connected client amount and traffic of ten APs with the top current usage. %Clients indicates the proportion of current connected clients to the Top APs' acceptable client capacity. %Traffic indicates the proportion of the AP's current data transmission amount to the Top APs' total transmission amount. The AP's transmission amount equals the sum of the transmission traffic of all the current clients that connect to the AP. Its maximum transmission capacity depends on its radio configuration. 3.2.4 View Recent Activities The Recent Activities statistics can be toggled between a view for the past specific 24 hours and one for the past specific 30 days. The left ordinate axis indicates the traffic and the right ordinate axis represents the number of the clients. The bottom abscissa axis shows the selected time period. Traffic indicates a visual graph of the network traffic during the selected time period. Client indicates a visual graph of the number of the connected clients during the selected time period. For example, the statistics information at 8:00 indicates the traffic size and client number from 7:00 to 8:00. 16
-
 1
1 -
2
-
3
-
4
-
5
-
6
-
7
-
8
-
9
-
10
-
11
-
12
-
13
-
14
-
 15
15 -
 16
16 -
 17
17 -
 18
18 -
 19
19 -
 20
20 -
 21
21 -
 22
22 -
 23
23 -
 24
24 -
 25
25 -
26
-
27
-
28
-
29
-
30
-
31
-
32
-
33
-
34
-
35
-
36
-
37
-
38
-
39
-
40
-
41
-
42
-
43
-
44
-
45
-
46
-
47
-
48
-
49
-
50
-
51
-
52
-
53
-
54
-
55
-
56
-
57
-
58
-
59
-
60
-
61
-
62
-
63
-
64
-
65
-
66
-
67
-
68
-
69
-
70
-
71
-
72
 |
 |