Texas Instruments TINSPIRE Reference Guide - Page 103
GF GF GF GF GF - calculator case
 |
View all Texas Instruments TINSPIRE manuals
Add to My Manuals
Save this manual to your list of manuals |
Page 103 highlights
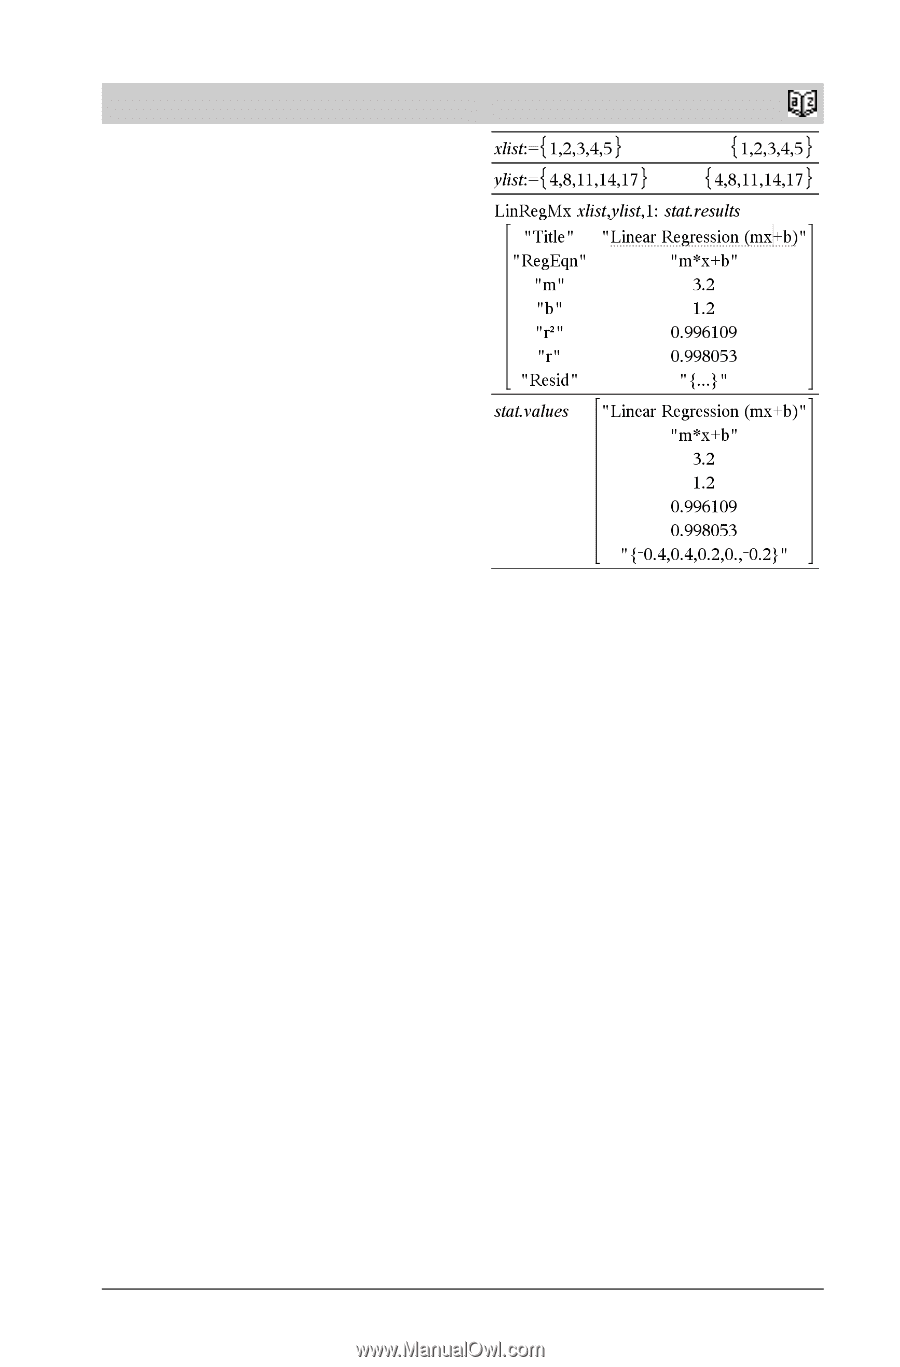
stat.results stat.results Displays results from a statistics calculation. The results are displayed as a set of name-value pairs. The specific names shown are dependent on the most recently evaluated statistics function or command. You can copy a name or value and paste it into other locations. Note: Avoid defining variables that use the same names as those used for statistical analysis. In some cases, an error condition could occur. Variable names used for statistical analysis are listed in the table below. Catalog > stat.a stat.AdjR² stat.b stat.b0 stat.b1 stat.b2 stat.b3 stat.b4 stat.b5 stat.b6 stat.b7 stat.b8 stat.b9 stat.b10 stat.bList stat.c² stat.c stat.CLower stat.CLowerList stat.CompList stat.CompMatrix stat.CookDist stat.CUpper stat.CUpperList stat.d stat.dfDenom stat.dfBlock stat.dfCol stat.dfError stat.dfInteract stat.dfReg stat.dfNumer stat.dfRow stat.DW stat.e stat.ExpMatrix stat.F stat.FBlock stat.Fcol stat.FInteract stat.FreqReg stat.Frow stat.Leverage stat.LowerPred stat.LowerVal stat.m stat.MaxX stat.MaxY stat.ME stat.MedianX stat.MedianY stat.MEPred stat.MinX stat.MinY stat.MS stat.MSBlock stat.MSCol stat.MSError stat.MSInteract stat.MSReg stat.MSRow stat.n stat.Ç stat.Ç1 stat.Ç2 stat.ÇDiff stat.PList stat.PVal stat.PValBlock stat.PValCol stat.PValInteract stat.PValRow stat.Q1X stat.Q1Y stat.Q3X stat.Q3Y stat.r stat.r² stat.RegEqn stat.Resid stat.ResidTrans stat.sx stat.sy stat.sx1 stat.sx2 stat.Gx stat.Gx² stat.Gxy stat.Gy stat.Gy² stat.s stat.SE stat.SEList stat.SEPred stat.sResid stat.SEslope stat.sp stat.SS stat.SSBlock stat.SSCol stat.SSX stat.SSY stat.SSError stat.SSInteract stat.SSReg stat.SSRow stat.tList stat.UpperPred stat.UpperVal stat.v stat.v1 stat.v2 stat.vDiff stat.vList stat.XReg stat.XVal stat.XValList stat.w stat.y y stat. List stat.YReg Note: Each time the Lists & Spreadsheet application calculates statistical results, it copies the "stat." group variables to a "stat#." group, where # is a number that is incremented automatically. This lets you maintain previous results while performing multiple calculations. TI-Nspire™ Reference Guide 97
-
 1
1 -
2
-
3
-
4
-
5
-
6
-
7
-
8
-
9
-
10
-
11
-
12
-
13
-
14
-
15
-
16
-
17
-
18
-
19
-
20
-
21
-
22
-
23
-
24
-
25
-
26
-
27
-
28
-
29
-
30
-
31
-
32
-
33
-
34
-
35
-
36
-
37
-
38
-
39
-
40
-
41
-
42
-
43
-
44
-
45
-
46
-
47
-
48
-
49
-
50
-
51
-
52
-
53
-
54
-
55
-
56
-
57
-
58
-
59
-
60
-
61
-
62
-
63
-
64
-
65
-
66
-
67
-
68
-
69
-
70
-
71
-
72
-
73
-
74
-
75
-
76
-
77
-
78
-
79
-
80
-
81
-
82
-
83
-
84
-
85
-
86
-
87
-
88
-
89
-
90
-
91
-
92
-
93
-
94
-
95
-
96
-
97
-
 98
98 -
 99
99 -
 100
100 -
 101
101 -
 102
102 -
 103
103 -
 104
104 -
 105
105 -
 106
106 -
 107
107 -
 108
108 -
109
-
110
-
111
-
112
-
113
-
114
-
115
-
116
-
117
-
118
-
119
-
120
-
121
-
122
-
123
-
124
-
125
-
126
-
127
-
128
-
129
-
130
-
131
-
132
-
133
-
134
-
135
-
136
-
137
-
138
-
139
-
140
-
141
-
142
-
143
-
144
-
145
-
146
-
147
-
148
-
149
-
150
-
151
-
152
-
153
-
154
-
155
-
156
-
157
-
158
-
159
-
160
-
161
-
162
-
163
-
164
 |
 |