Texas Instruments TINSPIRE Reference Guide - Page 121
zTest_2Prop, Catalog >, Output variable, Description, Hypoth, stat.results, p < p0, List1, Freq1
 |
View all Texas Instruments TINSPIRE manuals
Add to My Manuals
Save this manual to your list of manuals |
Page 121 highlights
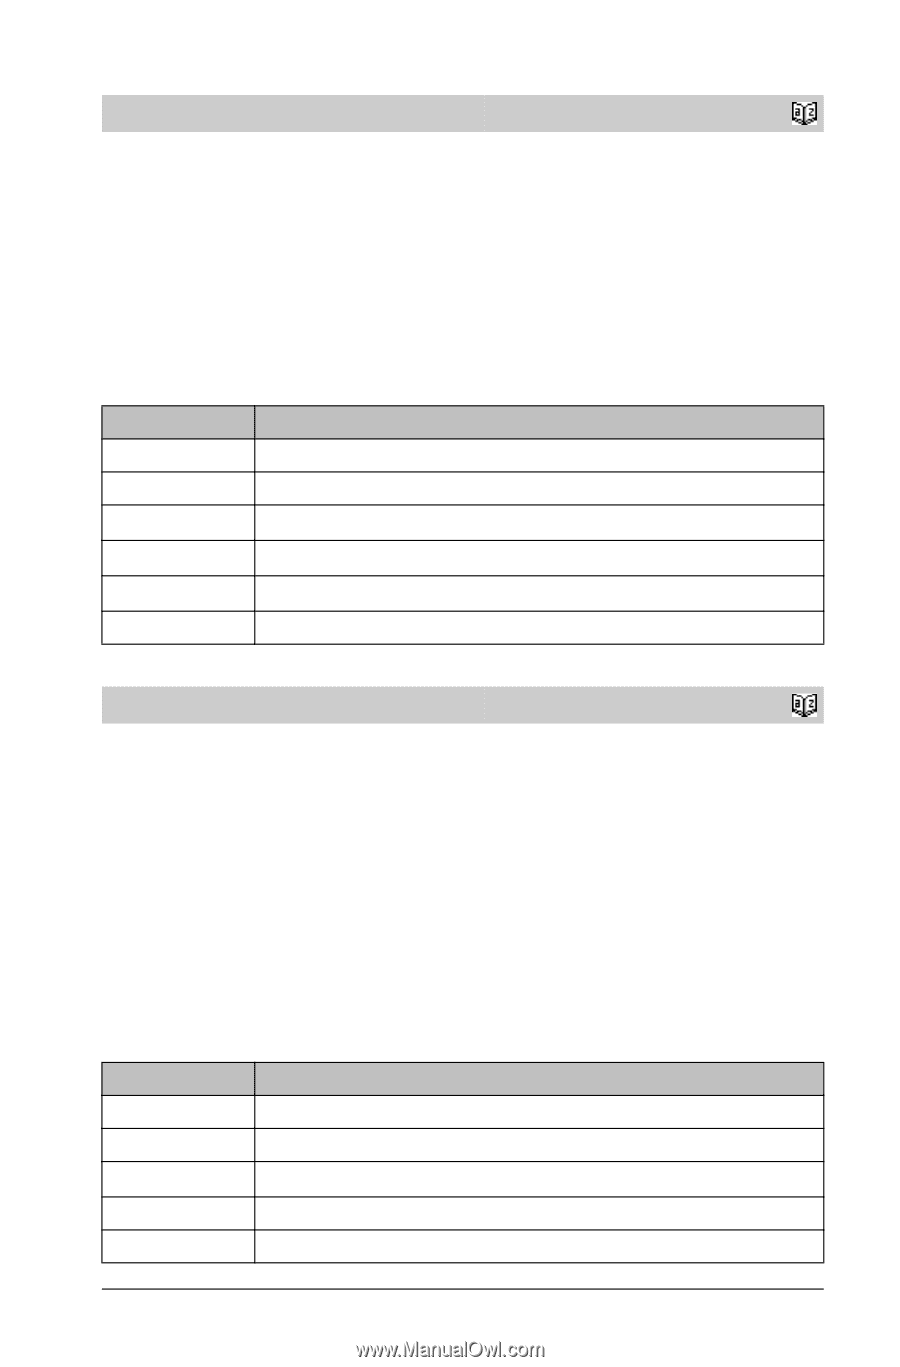
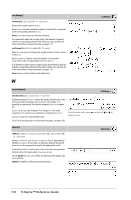
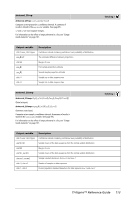
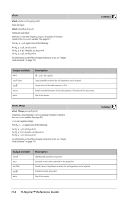
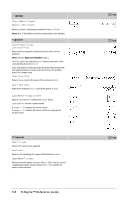
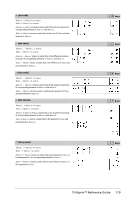
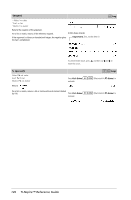
zTest_2Prop zTest_2Prop x1,n1,x2,n2[,Hypoth] Computes a two-proportion z test. A summary of results is stored in the stat.results variable. (See page 97.) x1 and x2 are non-negative integers. Test H0: p1 = p2, against one of the following: For Ha: p1 > p2, set Hypoth>0 For Ha: p1 ƒ p2 (default), set Hypoth=0 For Ha: p < p0, set Hypoth Output variable stat.z stat.PVal stat.Ç1 stat.Ç2 stat.Ç stat.n1, stat.n2 Description Standard normal value computed for the difference of proportions Smallest level of significance at which the null hypothesis can be rejected First sample proportion estimate Second sample proportion estimate Pooled sample proportion estimate Number of samples taken in trials 1 and 2 zTest_2Samp zTest_2Samp s1,s2 ,List1,List2[,Freq1[,Freq2[,Hypoth]]] (Data list input) zTest_2Samp s1,s2,v1,n1,v2,n2[,Hypoth] (Summary stats input) Computes a two-sample z test. A summary of results is stored in the stat.results variable. (See page 97.) Test H0: m1 = m2, against one of the following: For Ha: m1 < m2, set Hypoth m2, Hypoth>0 For information on the effect of empty elements in a list, see "Empty (void) elements" on page 131. Catalog > Output variable stat.z stat.PVal stat.x1, stat.x2 stat.sx1, stat.sx2 stat.n1, stat.n2 Description Standard normal value computed for the difference of means Smallest level of significance at which the null hypothesis can be rejected Sample means of the data sequences in List1 and List2 Sample standard deviations of the data sequences in List1 and List2 Size of the samples TI-Nspire™ Reference Guide 115
-
 1
1 -
2
-
3
-
4
-
5
-
6
-
7
-
8
-
9
-
10
-
11
-
12
-
13
-
14
-
15
-
16
-
17
-
18
-
19
-
20
-
21
-
22
-
23
-
24
-
25
-
26
-
27
-
28
-
29
-
30
-
31
-
32
-
33
-
34
-
35
-
36
-
37
-
38
-
39
-
40
-
41
-
42
-
43
-
44
-
45
-
46
-
47
-
48
-
49
-
50
-
51
-
52
-
53
-
54
-
55
-
56
-
57
-
58
-
59
-
60
-
61
-
62
-
63
-
64
-
65
-
66
-
67
-
68
-
69
-
70
-
71
-
72
-
73
-
74
-
75
-
76
-
77
-
78
-
79
-
80
-
81
-
82
-
83
-
84
-
85
-
86
-
87
-
88
-
89
-
90
-
91
-
92
-
93
-
94
-
95
-
96
-
97
-
98
-
99
-
100
-
101
-
102
-
103
-
104
-
105
-
106
-
107
-
108
-
109
-
110
-
111
-
112
-
113
-
114
-
115
-
 116
116 -
 117
117 -
 118
118 -
 119
119 -
 120
120 -
 121
121 -
 122
122 -
 123
123 -
 124
124 -
 125
125 -
 126
126 -
127
-
128
-
129
-
130
-
131
-
132
-
133
-
134
-
135
-
136
-
137
-
138
-
139
-
140
-
141
-
142
-
143
-
144
-
145
-
146
-
147
-
148
-
149
-
150
-
151
-
152
-
153
-
154
-
155
-
156
-
157
-
158
-
159
-
160
-
161
-
162
-
163
-
164
 |
 |