Texas Instruments TINSPIRE Reference Guide - Page 110
List1, Freq1, CLevel, Pooled, stat.results, number, squareMatrix, value, Degrees of freedom
 |
View all Texas Instruments TINSPIRE manuals
Add to My Manuals
Save this manual to your list of manuals |
Page 110 highlights
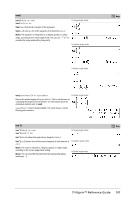
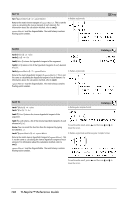
Output variable stat.n Description Length of the data sequence with sample mean tInterval_2Samp tInterval_2Samp List1,List2[,Freq1[,Freq2[,CLevel[,Pooled]]]] (Data list input) tInterval_2Samp v1,sx1,n1,v2,sx2,n2[,CLevel[,Pooled]] (Summary stats input) Computes a two-sample t confidence interval. A summary of results is stored in the stat.results variable. (See page 97.) Pooled=1 pools variances; Pooled=0 does not pool variances. For information on the effect of empty elements in a list, see "Empty (void) elements" on page 131. Output variable Description stat.CLower, stat.CUpper Confidence interval containing confidence level probability of distribution stat.x1-x2 Sample means of the data sequences from the normal random distribution stat.ME Margin of error stat.df Degrees of freedom stat.x1, stat.x2 Sample means of the data sequences from the normal random distribution stat.sx1, stat.sx2 Sample standard deviations for List 1 and List 2 stat.n1, stat.n2 Number of samples in data sequences stat.sp The pooled standard deviation. Calculated when Pooled = YES tPdf() tPdf(XVal,df) ⇒ number if XVal is a number, list if XVal is a list Computes the probability density function (pdf) for the Student-t distribution at a specified x value with specified degrees of freedom df. trace() trace(squareMatrix) ⇒ value Returns the trace (sum of all the elements on the main diagonal) of squareMatrix. Catalog > Catalog > Catalog > 104 TI-Nspire™ Reference Guide
-
 1
1 -
2
-
3
-
4
-
5
-
6
-
7
-
8
-
9
-
10
-
11
-
12
-
13
-
14
-
15
-
16
-
17
-
18
-
19
-
20
-
21
-
22
-
23
-
24
-
25
-
26
-
27
-
28
-
29
-
30
-
31
-
32
-
33
-
34
-
35
-
36
-
37
-
38
-
39
-
40
-
41
-
42
-
43
-
44
-
45
-
46
-
47
-
48
-
49
-
50
-
51
-
52
-
53
-
54
-
55
-
56
-
57
-
58
-
59
-
60
-
61
-
62
-
63
-
64
-
65
-
66
-
67
-
68
-
69
-
70
-
71
-
72
-
73
-
74
-
75
-
76
-
77
-
78
-
79
-
80
-
81
-
82
-
83
-
84
-
85
-
86
-
87
-
88
-
89
-
90
-
91
-
92
-
93
-
94
-
95
-
96
-
97
-
98
-
99
-
100
-
101
-
102
-
103
-
104
-
 105
105 -
 106
106 -
 107
107 -
 108
108 -
 109
109 -
 110
110 -
 111
111 -
 112
112 -
 113
113 -
 114
114 -
 115
115 -
116
-
117
-
118
-
119
-
120
-
121
-
122
-
123
-
124
-
125
-
126
-
127
-
128
-
129
-
130
-
131
-
132
-
133
-
134
-
135
-
136
-
137
-
138
-
139
-
140
-
141
-
142
-
143
-
144
-
145
-
146
-
147
-
148
-
149
-
150
-
151
-
152
-
153
-
154
-
155
-
156
-
157
-
158
-
159
-
160
-
161
-
162
-
163
-
164
 |
 |