Texas Instruments TINSPIRE Reference Guide - Page 58
LinRegMx, Catalog >, Output variable, Description, LinRegtIntervals, Regression Equation
 |
View all Texas Instruments TINSPIRE manuals
Add to My Manuals
Save this manual to your list of manuals |
Page 58 highlights
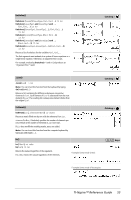
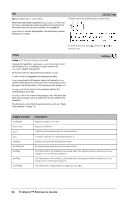
LinRegMx LinRegMx X,Y[,[Freq][,Category,Include]] Computes the linear regression y = m·x+b on lists X and Y with frequency Freq. A summary of results is stored in the stat.results variable. (See page 97.) All the lists must have equal dimension except for Include. X and Y are lists of independent and dependent variables. Freq is an optional list of frequency values. Each element in Freq specifies the frequency of occurrence for each corresponding X and Y data point. The default value is 1. All elements must be integers | 0. Category is a list of numeric or string category codes for the corresponding X and Y data. Include is a list of one or more of the category codes. Only those data items whose category code is included in this list are included in the calculation. For information on the effect of empty elements in a list, see "Empty (void) elements" on page 131. Catalog > Output variable stat.RegEqn stat.m, stat.b stat.r2 stat.r stat.Resid stat.XReg stat.YReg stat.FreqReg Description Regression Equation: y = m·x+b Regression coefficients Coefficient of determination Correlation coefficient Residuals from the regression List of data points in the modified X List actually used in the regression based on restrictions of Freq, Category List, and Include Categories List of data points in the modified Y List actually used in the regression based on restrictions of Freq, Category List, and Include Categories List of frequencies corresponding to stat.XReg and stat.YReg LinRegtIntervals LinRegtIntervals X,Y[,F[,0[,CLev]]] For Slope. Computes a level C confidence interval for the slope. LinRegtIntervals X,Y[,F[,1,Xval[,CLev]]] For Response. Computes a predicted y-value, a level C prediction interval for a single observation, and a level C confidence interval for the mean response. A summary of results is stored in the stat.results variable. (See page 97.) All the lists must have equal dimension. X and Y are lists of independent and dependent variables. F is an optional list of frequency values. Each element in F specifies the frequency of occurrence for each corresponding X and Y data point. The default value is 1. All elements must be integers | 0. For information on the effect of empty elements in a list, see "Empty (void) elements" on page 131. 52 TI-Nspire™ Reference Guide Catalog >
-
 1
1 -
2
-
3
-
4
-
5
-
6
-
7
-
8
-
9
-
10
-
11
-
12
-
13
-
14
-
15
-
16
-
17
-
18
-
19
-
20
-
21
-
22
-
23
-
24
-
25
-
26
-
27
-
28
-
29
-
30
-
31
-
32
-
33
-
34
-
35
-
36
-
37
-
38
-
39
-
40
-
41
-
42
-
43
-
44
-
45
-
46
-
47
-
48
-
49
-
50
-
51
-
52
-
 53
53 -
 54
54 -
 55
55 -
 56
56 -
 57
57 -
 58
58 -
 59
59 -
 60
60 -
 61
61 -
 62
62 -
 63
63 -
64
-
65
-
66
-
67
-
68
-
69
-
70
-
71
-
72
-
73
-
74
-
75
-
76
-
77
-
78
-
79
-
80
-
81
-
82
-
83
-
84
-
85
-
86
-
87
-
88
-
89
-
90
-
91
-
92
-
93
-
94
-
95
-
96
-
97
-
98
-
99
-
100
-
101
-
102
-
103
-
104
-
105
-
106
-
107
-
108
-
109
-
110
-
111
-
112
-
113
-
114
-
115
-
116
-
117
-
118
-
119
-
120
-
121
-
122
-
123
-
124
-
125
-
126
-
127
-
128
-
129
-
130
-
131
-
132
-
133
-
134
-
135
-
136
-
137
-
138
-
139
-
140
-
141
-
142
-
143
-
144
-
145
-
146
-
147
-
148
-
149
-
150
-
151
-
152
-
153
-
154
-
155
-
156
-
157
-
158
-
159
-
160
-
161
-
162
-
163
-
164
 |
 |