Texas Instruments TINSPIRE Reference Guide - Page 114
TwoVar, Catalog >, Output variable, Description
 |
View all Texas Instruments TINSPIRE manuals
Add to My Manuals
Save this manual to your list of manuals |
Page 114 highlights
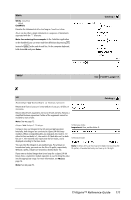
TwoVar TwoVar X, Y[, [Freq] [, Category, Include]] Calculates the TwoVar statistics. A summary of results is stored in the stat.results variable. (See page 97.) All the lists must have equal dimension except for Include. X and Y are lists of independent and dependent variables. Freq is an optional list of frequency values. Each element in Freq specifies the frequency of occurrence for each corresponding X and Y data point. The default value is 1. All elements must be integers | 0. Category is a list of numeric category codes for the corresponding X and Y data. Include is a list of one or more of the category codes. Only those data items whose category code is included in this list are included in the calculation. An empty (void) element in any of the lists X, Freq, or Category results in a void for the corresponding element of all those lists. An empty element in any of the lists X1 through X20 results in a void for the corresponding element of all those lists. For more information on empty elements, see page 131. Output variable stat.v stat.Gx stat.Gx2 stat.sx stat.sx stat.n stat.w stat.Gy stat.Gy2 stat.sy stat.sy stat.Gxy stat.r stat.MinX stat.Q1X stat.MedianX stat.Q3X stat.MaxX stat.MinY stat.Q1Y Description Mean of x values Sum of x values Sum of x2 values Sample standard deviation of x Population standard deviation of x Number of data points Mean of y values Sum of y values Sum of y2 values Sample standard deviation of y Population standard deviation of y Sum of x·y values Correlation coefficient Minimum of x values 1st Quartile of x Median of x 3rd Quartile of x Maximum of x values Minimum of y values 1st Quartile of y 108 TI-Nspire™ Reference Guide Catalog >
-
 1
1 -
2
-
3
-
4
-
5
-
6
-
7
-
8
-
9
-
10
-
11
-
12
-
13
-
14
-
15
-
16
-
17
-
18
-
19
-
20
-
21
-
22
-
23
-
24
-
25
-
26
-
27
-
28
-
29
-
30
-
31
-
32
-
33
-
34
-
35
-
36
-
37
-
38
-
39
-
40
-
41
-
42
-
43
-
44
-
45
-
46
-
47
-
48
-
49
-
50
-
51
-
52
-
53
-
54
-
55
-
56
-
57
-
58
-
59
-
60
-
61
-
62
-
63
-
64
-
65
-
66
-
67
-
68
-
69
-
70
-
71
-
72
-
73
-
74
-
75
-
76
-
77
-
78
-
79
-
80
-
81
-
82
-
83
-
84
-
85
-
86
-
87
-
88
-
89
-
90
-
91
-
92
-
93
-
94
-
95
-
96
-
97
-
98
-
99
-
100
-
101
-
102
-
103
-
104
-
105
-
106
-
107
-
108
-
 109
109 -
 110
110 -
 111
111 -
 112
112 -
 113
113 -
 114
114 -
 115
115 -
 116
116 -
 117
117 -
 118
118 -
 119
119 -
120
-
121
-
122
-
123
-
124
-
125
-
126
-
127
-
128
-
129
-
130
-
131
-
132
-
133
-
134
-
135
-
136
-
137
-
138
-
139
-
140
-
141
-
142
-
143
-
144
-
145
-
146
-
147
-
148
-
149
-
150
-
151
-
152
-
153
-
154
-
155
-
156
-
157
-
158
-
159
-
160
-
161
-
162
-
163
-
164
 |
 |