Texas Instruments TINSPIRE Reference Guide - Page 62
LnReg, Catalog >, Output variable, Description
 |
View all Texas Instruments TINSPIRE manuals
Add to My Manuals
Save this manual to your list of manuals |
Page 62 highlights
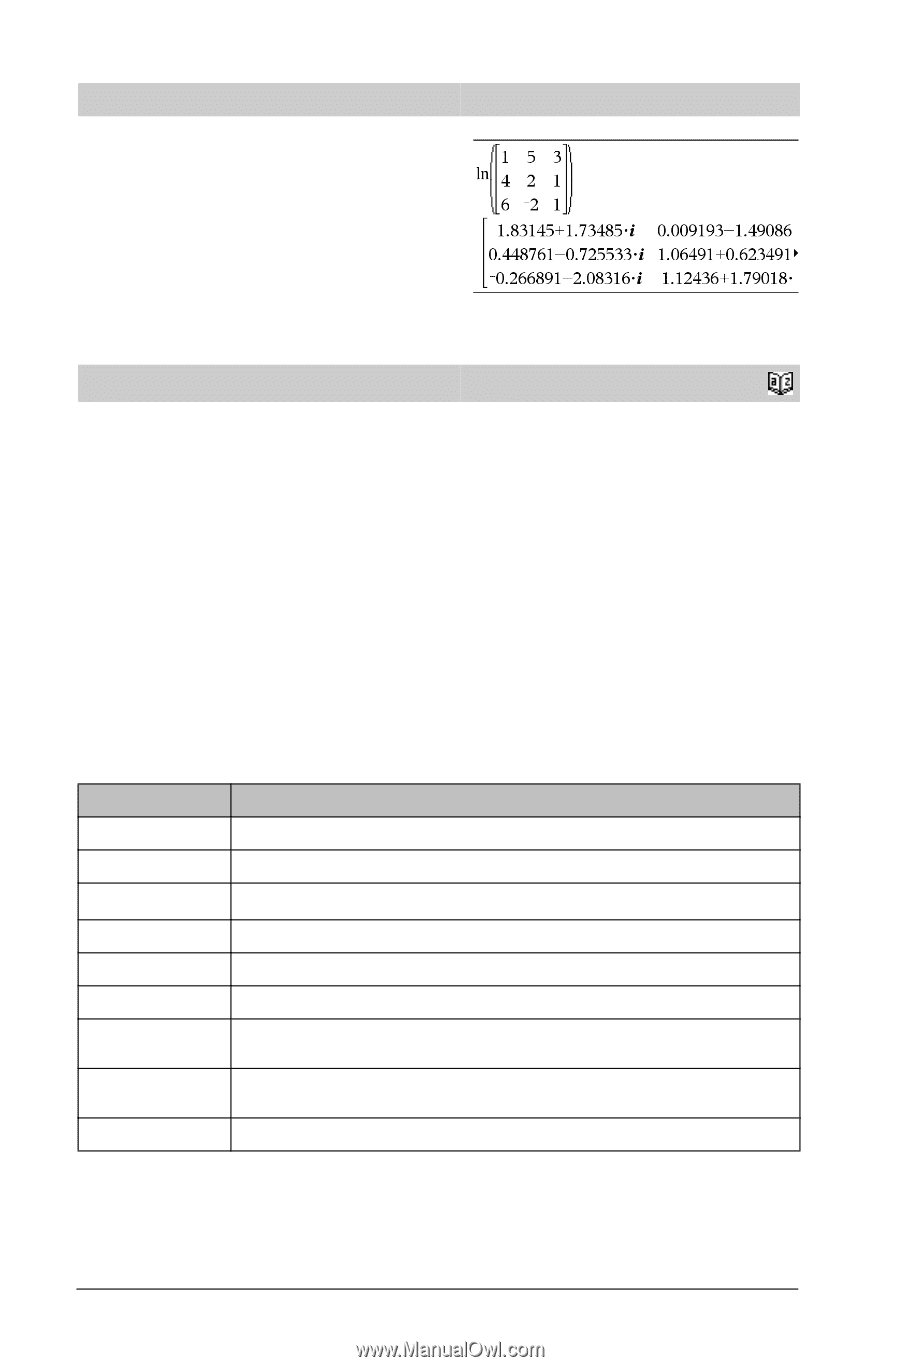
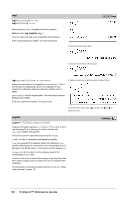
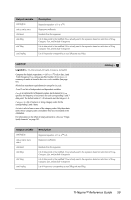
ln( ) ln(squareMatrix1) ⇒ squareMatrix Returns the matrix natural logarithm of squareMatrix1. This is not the same as calculating the natural logarithm of each element. For information about the calculation method, refer to cos() on. squareMatrix1 must be diagonalizable. The result always contains floating-point numbers. /u keys In Radian angle mode and Rectangular complex format: £ ¡ ¢ To see the entire result, press and then use and to move the cursor. LnReg LnReg X, Y[, [Freq] [, Category, Include]] Computes the logarithmic regression y = a+b·ln(x) on lists X and Y with frequency Freq. A summary of results is stored in the stat.results variable. (See page 97.) All the lists must have equal dimension except for Include. X and Y are lists of independent and dependent variables. Freq is an optional list of frequency values. Each element in Freq specifies the frequency of occurrence for each corresponding X and Y data point. The default value is 1. All elements must be integers | 0. Category is a list of numeric or string category codes for the corresponding X and Y data. Include is a list of one or more of the category codes. Only those data items whose category code is included in this list are included in the calculation. For information on the effect of empty elements in a list, see "Empty (void) elements" on page 131. Catalog > Output variable stat.RegEqn stat.a, stat.b stat.r2 stat.r stat.Resid stat.ResidTrans stat.XReg stat.YReg stat.FreqReg Description Regression equation: a+b·ln(x) Regression coefficients Coefficient of linear determination for transformed data Correlation coefficient for transformed data (ln(x), y) Residuals associated with the logarithmic model Residuals associated with linear fit of transformed data List of data points in the modified X List actually used in the regression based on restrictions of Freq, Category List, and Include Categories List of data points in the modified Y List actually used in the regression based on restrictions of Freq, Category List, and Include Categories List of frequencies corresponding to stat.XReg and stat.YReg 56 TI-Nspire™ Reference Guide
-
 1
1 -
2
-
3
-
4
-
5
-
6
-
7
-
8
-
9
-
10
-
11
-
12
-
13
-
14
-
15
-
16
-
17
-
18
-
19
-
20
-
21
-
22
-
23
-
24
-
25
-
26
-
27
-
28
-
29
-
30
-
31
-
32
-
33
-
34
-
35
-
36
-
37
-
38
-
39
-
40
-
41
-
42
-
43
-
44
-
45
-
46
-
47
-
48
-
49
-
50
-
51
-
52
-
53
-
54
-
55
-
56
-
 57
57 -
 58
58 -
 59
59 -
 60
60 -
 61
61 -
 62
62 -
 63
63 -
 64
64 -
 65
65 -
 66
66 -
 67
67 -
68
-
69
-
70
-
71
-
72
-
73
-
74
-
75
-
76
-
77
-
78
-
79
-
80
-
81
-
82
-
83
-
84
-
85
-
86
-
87
-
88
-
89
-
90
-
91
-
92
-
93
-
94
-
95
-
96
-
97
-
98
-
99
-
100
-
101
-
102
-
103
-
104
-
105
-
106
-
107
-
108
-
109
-
110
-
111
-
112
-
113
-
114
-
115
-
116
-
117
-
118
-
119
-
120
-
121
-
122
-
123
-
124
-
125
-
126
-
127
-
128
-
129
-
130
-
131
-
132
-
133
-
134
-
135
-
136
-
137
-
138
-
139
-
140
-
141
-
142
-
143
-
144
-
145
-
146
-
147
-
148
-
149
-
150
-
151
-
152
-
153
-
154
-
155
-
156
-
157
-
158
-
159
-
160
-
161
-
162
-
163
-
164
 |
 |