Texas Instruments TINSPIRE Reference Guide - Page 60
LinRegtTest, Catalog >, Output variable, Description
 |
View all Texas Instruments TINSPIRE manuals
Add to My Manuals
Save this manual to your list of manuals |
Page 60 highlights
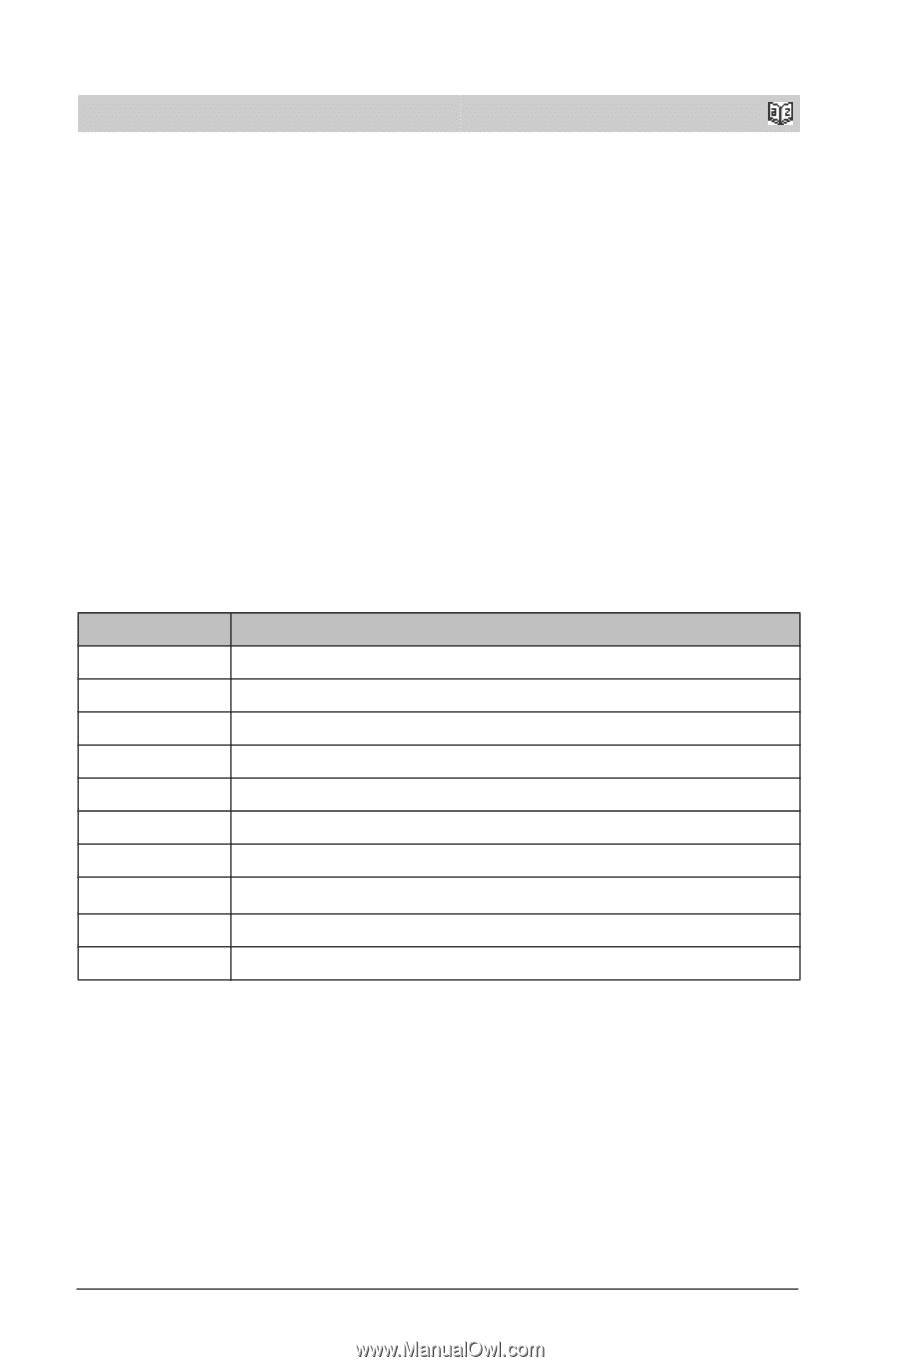
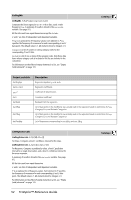
LinRegtTest LinRegtTest X,Y[,Freq[,Hypoth]] Computes a linear regression on the X and Y lists and a t test on the value of slope b and the correlation coefficient r for the equation y=a+bx. It tests the null hypothesis H0:b=0 (equivalently, r=0) against one of three alternative hypotheses. All the lists must have equal dimension. X and Y are lists of independent and dependent variables. Freq is an optional list of frequency values. Each element in Freq specifies the frequency of occurrence for each corresponding X and Y data point. The default value is 1. All elements must be integers | 0. Hypoth is an optional value specifying one of three alternative hypotheses against which the null hypothesis (H0:b=r=0) will be tested. For Ha: bƒ0 and rƒ0 (default), set Hypoth=0 For Ha: b0 A summary of results is stored in the stat.results variable. (See page 97.) For information on the effect of empty elements in a list, see "Empty (void) elements" on page 131. Output variable stat.RegEqn stat.t stat.PVal stat.df stat.a, stat.b stat.s stat.SESlope stat.r2 stat.r stat.Resid Description Regression equation: a + b·x t-Statistic for significance test Smallest level of significance at which the null hypothesis can be rejected Degrees of freedom Regression coefficients Standard error about the line Standard error of slope Coefficient of determination Correlation coefficient Residuals from the regression Catalog > 54 TI-Nspire™ Reference Guide
-
 1
1 -
2
-
3
-
4
-
5
-
6
-
7
-
8
-
9
-
10
-
11
-
12
-
13
-
14
-
15
-
16
-
17
-
18
-
19
-
20
-
21
-
22
-
23
-
24
-
25
-
26
-
27
-
28
-
29
-
30
-
31
-
32
-
33
-
34
-
35
-
36
-
37
-
38
-
39
-
40
-
41
-
42
-
43
-
44
-
45
-
46
-
47
-
48
-
49
-
50
-
51
-
52
-
53
-
54
-
 55
55 -
 56
56 -
 57
57 -
 58
58 -
 59
59 -
 60
60 -
 61
61 -
 62
62 -
 63
63 -
 64
64 -
 65
65 -
66
-
67
-
68
-
69
-
70
-
71
-
72
-
73
-
74
-
75
-
76
-
77
-
78
-
79
-
80
-
81
-
82
-
83
-
84
-
85
-
86
-
87
-
88
-
89
-
90
-
91
-
92
-
93
-
94
-
95
-
96
-
97
-
98
-
99
-
100
-
101
-
102
-
103
-
104
-
105
-
106
-
107
-
108
-
109
-
110
-
111
-
112
-
113
-
114
-
115
-
116
-
117
-
118
-
119
-
120
-
121
-
122
-
123
-
124
-
125
-
126
-
127
-
128
-
129
-
130
-
131
-
132
-
133
-
134
-
135
-
136
-
137
-
138
-
139
-
140
-
141
-
142
-
143
-
144
-
145
-
146
-
147
-
148
-
149
-
150
-
151
-
152
-
153
-
154
-
155
-
156
-
157
-
158
-
159
-
160
-
161
-
162
-
163
-
164
 |
 |