Canon EOS 20D EOS DIGITAL Software Instruction Manual (EOS Viewer Utility 1.2. - Page 46
Loading the Tone Curve, Tone Curve
 |
UPC - 013803044430
View all Canon EOS 20D manuals
Add to My Manuals
Save this manual to your list of manuals |
Page 46 highlights
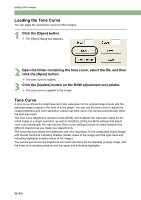
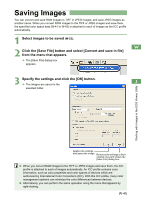
Editing RAW Images Loading the Tone Curve You can apply the saved tone curve to other images. 1 Click the [Open] button. ¿ The [Open] dialog box appears. 2 Open the folder containing the tone curve, select the file, and then click the [Open] button. ¿ The tone curve is loaded. 3 Click the [Update] button on the RAW adjustment tool palette. ¿ The tone curve is applied to the image. Tone Curve A tone curve shows the brightness and color saturation for the original image (input) and the adjusted image (output) in the form of a line graph. You can use the tone curve to adjust the image brightness and color saturation values that were set by the camera automatically when the shot was taken. The tone curve adjustment options include [RGB], which adjusts the input and output for the entire image in a single operation, as well as the [Rch], [Gch] and [Bch] settings that adjust each color individually. You can use the [Tone curve settings] list box to switch between the different channels as you make your adjustments. The horizontal axis shows the brightness and color saturation for the unadjusted (input) image, with the left-hand end indicating shadow (darker areas of the image) and the right-hand end indicating highlights (brighter areas of the image). The vertical axis shows the brightness and color saturation for the adjusted (output) image, with the lower end indicating shadow and the upper end indicating highlights. W-40
-
 1
1 -
2
-
3
-
4
-
5
-
6
-
7
-
8
-
9
-
10
-
11
-
12
-
13
-
14
-
15
-
16
-
17
-
18
-
19
-
20
-
21
-
22
-
23
-
24
-
25
-
26
-
27
-
28
-
29
-
30
-
31
-
32
-
33
-
34
-
35
-
36
-
37
-
38
-
39
-
40
-
 41
41 -
 42
42 -
 43
43 -
 44
44 -
 45
45 -
 46
46 -
 47
47 -
 48
48 -
 49
49 -
 50
50 -
 51
51 -
52
-
53
-
54
-
55
-
56
-
57
-
58
-
59
-
60
-
61
-
62
-
63
-
64
-
65
-
66
-
67
-
68
-
69
-
70
-
71
-
72
-
73
-
74
-
75
-
76
-
77
-
78
-
79
-
80
-
81
-
82
-
83
-
84
-
85
-
86
-
87
-
88
-
89
-
90
-
91
-
92
-
93
-
94
-
95
-
96
-
97
-
98
-
99
-
100
-
101
-
102
-
103
-
104
-
105
-
106
-
107
-
108
-
109
-
110
-
111
-
112
-
113
-
114
-
115
-
116
-
117
-
118
-
119
-
120
-
121
-
122
-
123
-
124
-
125
-
126
-
127
-
128
-
129
-
130
-
131
-
132
-
133
-
134
-
135
-
136
-
137
-
138
-
139
-
140
-
141
-
142
-
143
-
144
-
145
-
146
-
147
-
148
-
149
-
150
-
151
-
152
-
153
-
154
-
155
-
156
-
157
-
158
-
159
-
160
-
161
-
162
-
163
-
164
-
165
-
166
-
167
-
168
-
169
-
170
-
171
-
172
-
173
-
174
-
175
-
176
-
177
-
178
-
179
-
180
-
181
-
182
-
183
-
184
-
185
-
186
-
187
-
188
-
189
-
190
-
191
-
192
-
193
-
194
-
195
-
196
-
197
-
198
-
199
-
200
-
201
-
202
-
203
-
204
-
205
-
206
-
207
-
208
-
209
-
210
-
211
-
212
-
213
-
214
-
215
-
216
-
217
-
218
-
219
-
220
-
221
-
222
 |
 |
