Garmin GPSMAP 441s Owner's Manual - Page 81
Viewing Visibility Information, Understanding Wave Period
 |
View all Garmin GPSMAP 441s manuals
Add to My Manuals
Save this manual to your list of manuals |
Page 81 highlights
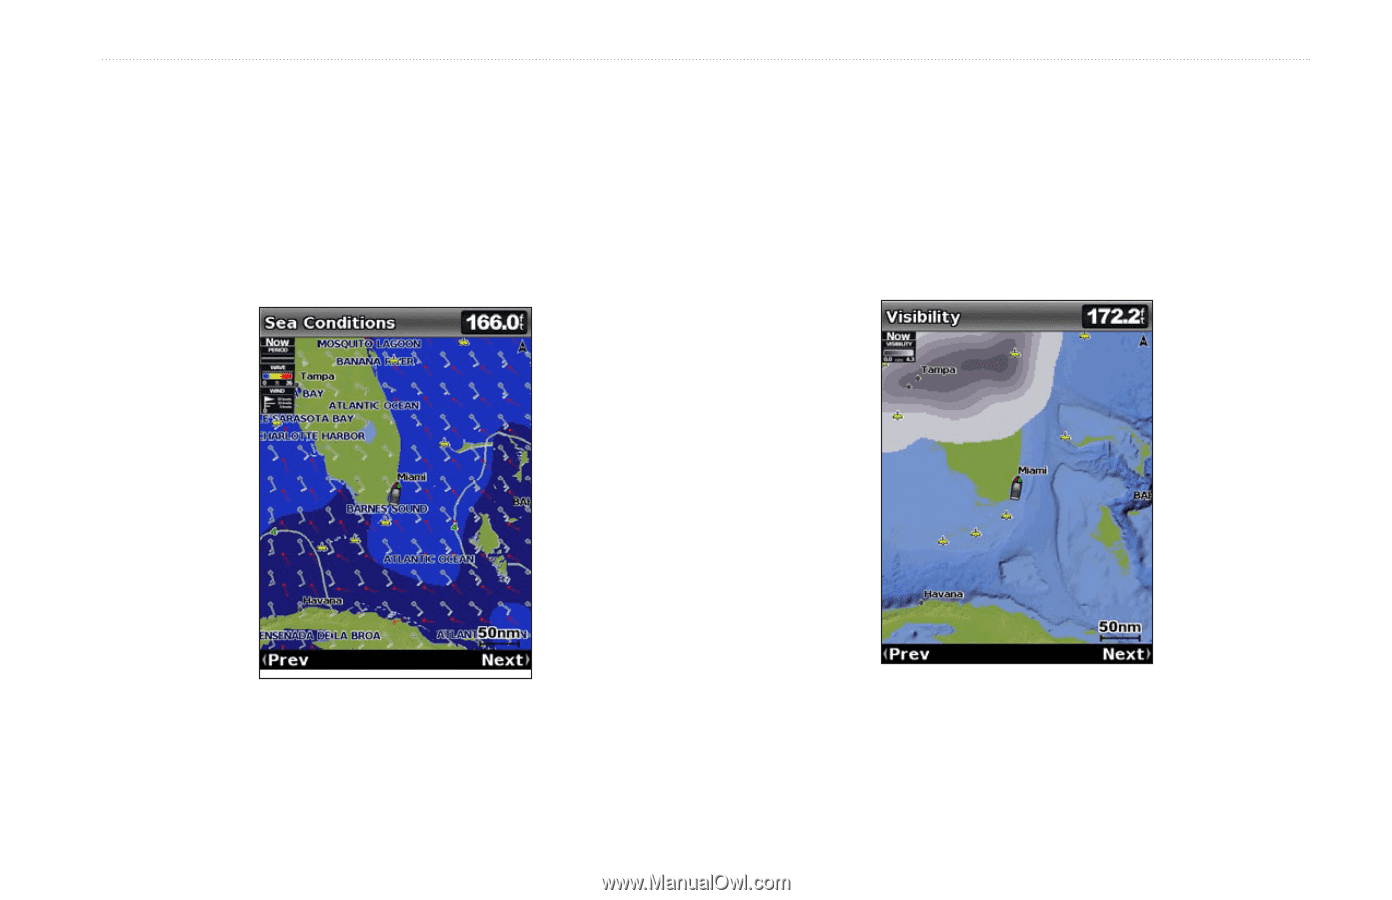
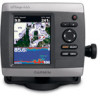
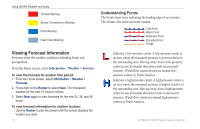
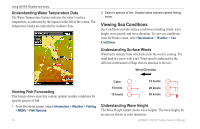
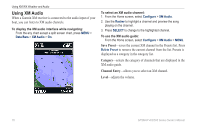
Understanding Wave Period The Wave Period feature provides the time (in seconds) between successive waves. Understanding Wave Direction The Wave Direction feature shows the direction in which a wave is moving, as indicated by the direction of the red arrow. Using XM WX Weather and Audio Viewing Visibility Information Visibility is the forecast maximum horizontal distance that can be seen at the surface, as indicated by the legend on the left of the screen. Contour lines on the Visibility feature show the forecasted change in surface visibility. From the Home screen, select Information > Weather > Visibility. To view the forecasted visibility for another time period: 1. Press right on the Rocker to select Next. The forecasted visibility for the next 12 hours is shown. 2. Select Next again to view forecasts for the next 24 and 36 hours. GPSMAP 400/500 Series Owner's Manual 75
-
 1
1 -
2
-
3
-
4
-
5
-
6
-
7
-
8
-
9
-
10
-
11
-
12
-
13
-
14
-
15
-
16
-
17
-
18
-
19
-
20
-
21
-
22
-
23
-
24
-
25
-
26
-
27
-
28
-
29
-
30
-
31
-
32
-
33
-
34
-
35
-
36
-
37
-
38
-
39
-
40
-
41
-
42
-
43
-
44
-
45
-
46
-
47
-
48
-
49
-
50
-
51
-
52
-
53
-
54
-
55
-
56
-
57
-
58
-
59
-
60
-
61
-
62
-
63
-
64
-
65
-
66
-
67
-
68
-
69
-
70
-
71
-
72
-
73
-
74
-
75
-
 76
76 -
 77
77 -
 78
78 -
 79
79 -
 80
80 -
 81
81 -
 82
82 -
 83
83 -
 84
84 -
 85
85 -
 86
86 -
87
-
88
-
89
-
90
-
91
-
92
-
93
-
94
-
95
-
96
 |
 |