Texas Instruments TINSPIRE Data Collection Guidebook - Page 29
Displaying Multiple Graphs, Displaying Graphs in the Layout View, To use Layout
 |
View all Texas Instruments TINSPIRE manuals
Add to My Manuals
Save this manual to your list of manuals |
Page 29 highlights
Displaying Multiple Graphs To display both Graph 1 and Graph 2 together: Select Graph > Show Graph > Both. Graph1 and Graph 2 are displayed. Displaying Graphs in the Page Layout View Use the Page layout view when Show Graph is not the appropriate solution for showing more than one graph. The Show Graph option is not applicable when: • You have multiple runs using a single sensor. • You use two or more of the same sensors. • You use multiple sensors that use the same column(s) of data. To use Page Layout: Working in the Graph View 25
-
 1
1 -
2
-
3
-
4
-
5
-
6
-
7
-
8
-
9
-
10
-
11
-
12
-
13
-
14
-
15
-
16
-
17
-
18
-
19
-
20
-
21
-
22
-
23
-
 24
24 -
 25
25 -
 26
26 -
 27
27 -
 28
28 -
 29
29 -
 30
30 -
 31
31 -
 32
32 -
 33
33 -
 34
34 -
35
-
36
-
37
-
38
-
39
-
40
-
41
-
42
-
43
-
44
-
45
-
46
-
47
-
48
-
49
-
50
-
51
-
52
-
53
-
54
-
55
-
56
-
57
-
58
-
59
-
60
-
61
-
62
-
63
-
64
-
65
-
66
-
67
-
68
-
69
-
70
-
71
-
72
-
73
-
74
-
75
-
76
-
77
-
78
-
79
-
80
-
81
-
82
-
83
-
84
-
85
-
86
-
87
-
88
-
89
-
90
-
91
-
92
-
93
-
94
-
95
-
96
-
97
-
98
-
99
-
100
-
101
-
102
-
103
-
104
-
105
-
106
-
107
-
108
-
109
-
110
-
111
-
112
 |
 |

Working in the Graph View
25
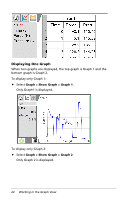
Displaying Multiple Graphs
To display both Graph 1 and Graph 2 together:
Select
Graph > Show Graph > Both
.
Graph1 and Graph 2 are displayed.
Displaying Graphs in the Page Layout View
Use the Page layout view when Show Graph is not the appropriate
solution for showing more than one graph.
The Show Graph option is not applicable when:
•
You have multiple runs using a single sensor.
•
You use two or more of the same sensors.
•
You use multiple sensors that use the same column(s) of data.
To use Page Layout: