Texas Instruments TINSPIRE Data Collection Guidebook - Page 55
Analyzing Data in Graph View, Viewing Data for Analysis, Examining the View Details Area Data
 |
View all Texas Instruments TINSPIRE manuals
Add to My Manuals
Save this manual to your list of manuals |
Page 55 highlights
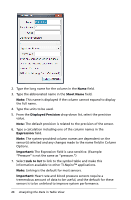
Analyzing Data in Graph View In the Vernier DataQuest™ application, use Graph View to analyze data. Start by setting up graphs, and then using analysis tools such as integral, statistics, and curve fit to investigate the mathematical nature of the data. Important: The Graph menu and Analyze menu items are only available when working in Graph View. Viewing Data for Analysis When analyzing data, you can view information in the View Details area, the View All Details dialog box, or on the graph. Examining the View Details Area Data When you perform analysis options, open the All Details for Graph dialog box to examine the details for the data. You can open and close this dialog box as often as you need. Important: Some information is only shown in the View Details dialog box. The detail information is shown in the View Details area even when the dialog box is closed. You can expand the View Details area to have more space to display information. To view details for collected data: 1. Right-click in the View Detail area to open the menu. Handheld: Press / b . 2. Click Details > All Details. The All Details for Graph dialog box opens. Analyzing Data in Graph View 51
-
 1
1 -
2
-
3
-
4
-
5
-
6
-
7
-
8
-
9
-
10
-
11
-
12
-
13
-
14
-
15
-
16
-
17
-
18
-
19
-
20
-
21
-
22
-
23
-
24
-
25
-
26
-
27
-
28
-
29
-
30
-
31
-
32
-
33
-
34
-
35
-
36
-
37
-
38
-
39
-
40
-
41
-
42
-
43
-
44
-
45
-
46
-
47
-
48
-
49
-
 50
50 -
 51
51 -
 52
52 -
 53
53 -
 54
54 -
 55
55 -
 56
56 -
 57
57 -
 58
58 -
 59
59 -
 60
60 -
61
-
62
-
63
-
64
-
65
-
66
-
67
-
68
-
69
-
70
-
71
-
72
-
73
-
74
-
75
-
76
-
77
-
78
-
79
-
80
-
81
-
82
-
83
-
84
-
85
-
86
-
87
-
88
-
89
-
90
-
91
-
92
-
93
-
94
-
95
-
96
-
97
-
98
-
99
-
100
-
101
-
102
-
103
-
104
-
105
-
106
-
107
-
108
-
109
-
110
-
111
-
112
 |
 |
