Texas Instruments TINSPIRE Data Collection Guidebook - Page 41
Changing Point Colors, The data option is often preceded by the data set name
 |
View all Texas Instruments TINSPIRE manuals
Add to My Manuals
Save this manual to your list of manuals |
Page 41 highlights
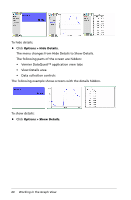
Changing Point Colors To change the color of the marks from the default settings. Note: On a TI-Nspire™ handheld, color is represented by different shades of gray. 1. Right-click the graph to open the menu. 2. Click Color. Note: The data option is often preceded by the data set name and column name. 3. Click the column variable to change. 4. Click the color. The line representing the data changes to the color selected. In this example, Force was selected and green was the color chosen. Working in the Graph View 37
-
 1
1 -
2
-
3
-
4
-
5
-
6
-
7
-
8
-
9
-
10
-
11
-
12
-
13
-
14
-
15
-
16
-
17
-
18
-
19
-
20
-
21
-
22
-
23
-
24
-
25
-
26
-
27
-
28
-
29
-
30
-
31
-
32
-
33
-
34
-
35
-
 36
36 -
 37
37 -
 38
38 -
 39
39 -
 40
40 -
 41
41 -
 42
42 -
 43
43 -
 44
44 -
 45
45 -
 46
46 -
47
-
48
-
49
-
50
-
51
-
52
-
53
-
54
-
55
-
56
-
57
-
58
-
59
-
60
-
61
-
62
-
63
-
64
-
65
-
66
-
67
-
68
-
69
-
70
-
71
-
72
-
73
-
74
-
75
-
76
-
77
-
78
-
79
-
80
-
81
-
82
-
83
-
84
-
85
-
86
-
87
-
88
-
89
-
90
-
91
-
92
-
93
-
94
-
95
-
96
-
97
-
98
-
99
-
100
-
101
-
102
-
103
-
104
-
105
-
106
-
107
-
108
-
109
-
110
-
111
-
112
 |
 |

Working in the Graph View
37
Changing Point Colors
To change the color of the marks from the default settings.
Note:
On a TI-Nspire™ handheld, color is represented by different
shades of gray.
1.
Right-click the graph to open the menu.
2.
Click
Color
.
Note:
The data option is often preceded by the data set name and
column name.
3.
Click the column variable to change.
4.
Click the color.
The line representing the data changes to the color selected.
In this example, Force was selected and green was the color chosen.