Texas Instruments TINSPIRE Data Collection Guidebook - Page 7
Learning About Menus, Like other TI-Nspire™ applications, the Vernier DataQuest™
 |
View all Texas Instruments TINSPIRE manuals
Add to My Manuals
Save this manual to your list of manuals |
Page 7 highlights
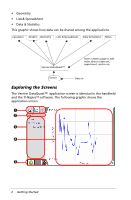
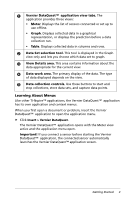
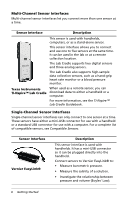
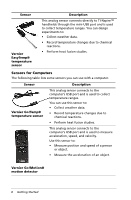
À Vernier DataQuest™ application view tabs. The application provides three views: • Meter. Displays the list of sensors connected or set up to use offline. • Graph. Displays collected data in a graphical representation, or displays the prediction before a data collection run. • Table. Displays collected data in columns and rows. Á Data Set selection tool. This tool is displayed in the Graph view only and lets you choose which data set to graph. Â View Details area. This area contains information about the data appropriate for the current view. Ã Data work area. The primary display of the data. The type of data displayed depends on the view. Ä Data collection controls. Use these buttons to start and stop collections, store data sets, and capture data points. Learning About Menus Like other TI-Nspire™ applications, the Vernier DataQuest™ application has its own application and context menus. When you first open a document or problem, insert the Vernier DataQuest™ application to open the application menu. Click Insert > Vernier DataQuest. The Vernier DataQuest™ application opens with the Meter view active and the application menu open. Important! If you connect a sensor before starting the Vernier DataQuest™ application, the connected sensor automatically launches the Vernier DataQuest™ application screen. Getting Started 3
-
 1
1 -
 2
2 -
 3
3 -
 4
4 -
 5
5 -
 6
6 -
 7
7 -
 8
8 -
 9
9 -
 10
10 -
 11
11 -
 12
12 -
13
-
14
-
15
-
16
-
17
-
18
-
19
-
20
-
21
-
22
-
23
-
24
-
25
-
26
-
27
-
28
-
29
-
30
-
31
-
32
-
33
-
34
-
35
-
36
-
37
-
38
-
39
-
40
-
41
-
42
-
43
-
44
-
45
-
46
-
47
-
48
-
49
-
50
-
51
-
52
-
53
-
54
-
55
-
56
-
57
-
58
-
59
-
60
-
61
-
62
-
63
-
64
-
65
-
66
-
67
-
68
-
69
-
70
-
71
-
72
-
73
-
74
-
75
-
76
-
77
-
78
-
79
-
80
-
81
-
82
-
83
-
84
-
85
-
86
-
87
-
88
-
89
-
90
-
91
-
92
-
93
-
94
-
95
-
96
-
97
-
98
-
99
-
100
-
101
-
102
-
103
-
104
-
105
-
106
-
107
-
108
-
109
-
110
-
111
-
112
 |
 |
