Texas Instruments TINSPIRE Data Collection Guidebook - Page 43
Selecting an Independent Variable Column, Showing and Hiding Details
 |
View all Texas Instruments TINSPIRE manuals
Add to My Manuals
Save this manual to your list of manuals |
Page 43 highlights
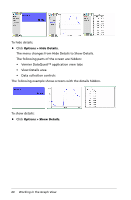
Selecting an Independent Variable Column Use the option Select X-axis Column to select the column used as the independent variable when graphing the data. This column is used for all graphs. 1. Click Graph > Select X-axis Column. 2. Select the variable you want to change. The x-axis label on the graph changes and the graph is reordered using the new independent variable for graphing the data. Selecting a Dependent Variable Column Use the option Select Y-axis Column to select which dependent variable columns to plot on the displayed graph(s). 1. Click Graph > Select Y-axis Column. 2. Select one of the following: • A variable from the list. The list is a combination of dependent variables and the number of data sets. • More. Selecting More opens the Select dialog box. Use this when you want to select a combination of data set variables to graph. Showing and Hiding Details You can hide parts of the screen to provide a larger view of the screen. The following example shows screens with the details shown. Working in the Graph View 39
-
 1
1 -
2
-
3
-
4
-
5
-
6
-
7
-
8
-
9
-
10
-
11
-
12
-
13
-
14
-
15
-
16
-
17
-
18
-
19
-
20
-
21
-
22
-
23
-
24
-
25
-
26
-
27
-
28
-
29
-
30
-
31
-
32
-
33
-
34
-
35
-
36
-
37
-
 38
38 -
 39
39 -
 40
40 -
 41
41 -
 42
42 -
 43
43 -
 44
44 -
 45
45 -
 46
46 -
 47
47 -
 48
48 -
49
-
50
-
51
-
52
-
53
-
54
-
55
-
56
-
57
-
58
-
59
-
60
-
61
-
62
-
63
-
64
-
65
-
66
-
67
-
68
-
69
-
70
-
71
-
72
-
73
-
74
-
75
-
76
-
77
-
78
-
79
-
80
-
81
-
82
-
83
-
84
-
85
-
86
-
87
-
88
-
89
-
90
-
91
-
92
-
93
-
94
-
95
-
96
-
97
-
98
-
99
-
100
-
101
-
102
-
103
-
104
-
105
-
106
-
107
-
108
-
109
-
110
-
111
-
112
 |
 |
