Campbell Scientific CSAT3B CSAT3B Three-Dimensional Sonic Anemometer - Page 60
Synchronization with other sensors
 |
View all Campbell Scientific CSAT3B manuals
Add to My Manuals
Save this manual to your list of manuals |
Page 60 highlights
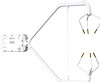
CSAT3B Three-Dimensional Sonic Anemometer FIGURE 8-2. Example of unprompted RS-485 or USB output to PC TABLE 8-3. CSAT3B Synchronicity Errors Mode 1 2 3 and 4 Synchronicity Error 0 ms −5 to +5 ms 10 Hz 0 to 100 ms Output Rate 20 Hz 50 Hz 0 to 50 ms 0 to 20 ms 100 Hz 0 to 10 ms 8.2.4 Operating Mode Recommendations Due to the advantages in making synchronous measurements, Campbell Scientific recommends using a datalogger that supports SDM or CPI communications to collect data from the CSAT3B. If flux measurements are the primary interest, Campbell Scientific further recommends that the CSAT3B be operated in Mode 1 where the datalogger triggers the measurements, no filters are applied, and the data are collected by the datalogger. If unaliased spectra are desired for characterization of the system and site, Mode 2 is recommended in which the measurements are selftriggered, a filter is applied with a bandwidth that is half the datalogger scan rate, and the data are collected with the datalogger. 8.3 Synchronization with other sensors As there is a delay between the CSAT3B's measurement and output to a datalogger or PC (see TABLE 8-2), the CSAT3B data will be slightly older than the record's timestamp (recall that the timestamp is assigned to the record by the datalogger or PC). This delay is not important when calculating covariances between variables from the CSAT3B since the variables are already synchronized and aligned with one another. However, when covariances are being calculated between CSAT3B data and data from other fast-response sensors, the time difference must be accounted for. As an example, suppose a datalogger is making 10 Hz (100 ms) measurements of a CSAT3B and an analog sensor such as a fine-wire thermocouple. In the raw data table of the datalogger, the timestamp for the thermocouple data will be 50
-
 1
1 -
2
-
3
-
4
-
5
-
6
-
7
-
8
-
9
-
10
-
11
-
12
-
13
-
14
-
15
-
16
-
17
-
18
-
19
-
20
-
21
-
22
-
23
-
24
-
25
-
26
-
27
-
28
-
29
-
30
-
31
-
32
-
33
-
34
-
35
-
36
-
37
-
38
-
39
-
40
-
41
-
42
-
43
-
44
-
45
-
46
-
47
-
48
-
49
-
50
-
51
-
52
-
53
-
54
-
 55
55 -
 56
56 -
 57
57 -
 58
58 -
 59
59 -
 60
60 -
 61
61 -
 62
62 -
 63
63 -
 64
64 -
 65
65 -
66
-
67
-
68
-
69
-
70
-
71
-
72
-
73
-
74
-
75
-
76
-
77
-
78
-
79
-
80
-
81
-
82
-
83
-
84
-
85
-
86
-
87
-
88
 |
 |
