Campbell Scientific CSAT3B CSAT3B Three-Dimensional Sonic Anemometer - Page 68
Test for Wind Offset
 |
View all Campbell Scientific CSAT3B manuals
Add to My Manuals
Save this manual to your list of manuals |
Page 68 highlights
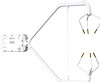
CSAT3B Three-Dimensional Sonic Anemometer Section 6, Specifications, is another indication that a recalibration is due. To check for wind offset, refer to Section 9.4.1, Test for Wind Offset. 9.4.1 Test for Wind Offset Testing wind offset on a CSAT3B requires creating an environment where there is no wind. Because it is difficult to do this in the field, wind offset data from the CSAT3B should be collected in a field office or the lab. A zero-wind environment can be created with a kitchen waste bin liner. The following steps should be taken to test the CSAT3B for wind offset. 1. Mount the head using the horizontal mount boom (as described in Section 4.1, Hardware Connections, or hang the head from the block that supports the CSAT3B upper and lower arms. Do not lay the CAST3B head on its side or balance it on the transducers, as this will affect its measurements. 2. Cover the CSAT3B head with a medium (13-gallon) kitchen waste bin liner. Close the opening of the liner by folding, taping, or tying, to prevent air from moving in and out of the liner. Temporarily disable the HVAC system in the room, or cover air vents that may cause air drafts to pass by the CSAT3B. Ensure that the liner does not obstruct any of the three CSAT3B sonic paths. 3. Connect the CSAT3B power and communications cable to the datalogger referring to Section 4.2, Communications Connections. Connect to the datalogger with PC200W, PC400, or LoggerNet. 4. Use the real time monitoring graph display to create two graphs. a. On the first graph add the ux and uy wind components and set the y limits from −0.08 to 0.08 as shown in FIGURE 9-3. b. On the second graph add the uz wind component and set the y limits from −0.04 to 0.04 as shown in FIGURE 9-4. c. For both graphs, set Graph Width to 1 minute and Update Interval to 1 second. 58
-
 1
1 -
2
-
3
-
4
-
5
-
6
-
7
-
8
-
9
-
10
-
11
-
12
-
13
-
14
-
15
-
16
-
17
-
18
-
19
-
20
-
21
-
22
-
23
-
24
-
25
-
26
-
27
-
28
-
29
-
30
-
31
-
32
-
33
-
34
-
35
-
36
-
37
-
38
-
39
-
40
-
41
-
42
-
43
-
44
-
45
-
46
-
47
-
48
-
49
-
50
-
51
-
52
-
53
-
54
-
55
-
56
-
57
-
58
-
59
-
60
-
61
-
62
-
 63
63 -
 64
64 -
 65
65 -
 66
66 -
 67
67 -
 68
68 -
 69
69 -
 70
70 -
 71
71 -
 72
72 -
 73
73 -
74
-
75
-
76
-
77
-
78
-
79
-
80
-
81
-
82
-
83
-
84
-
85
-
86
-
87
-
88
 |
 |
