Canon CanoScan D660U Canon Plug-in Module CS-U3.9 User's Guide - Page 39
Histogram Settings, How to Interpret Histograms
 |
View all Canon CanoScan D660U manuals
Add to My Manuals
Save this manual to your list of manuals |
Page 39 highlights
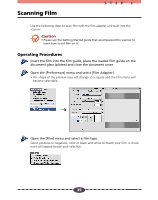
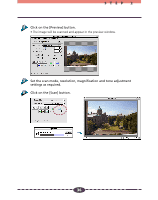
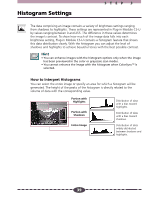
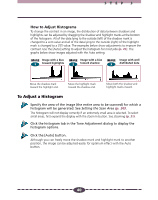
Histogram Settings STEP 3 The data comprising an image contains a variety of brightness settings ranging from shadows to highlights. These settings are represented in Plug-in Module CS-U by values ranging between 0 and 255. The difference in these values determines the image's contrast. To show how much of the image data falls into each brightness setting, Plug-in Module CS-U contains a histogram feature that shows this data distribution clearly. With the histogram you can adjust the level of shadows and highlights to achieve beautiful tones with the best possible contrast. Hint • You can enhance images with the histogram options only when the image has been previewed in the color or grayscale scan modes. • You cannot enhance the image with the histogram when ColorSyncTM is selected. How to Interpret Histograms You can select the entire image or specify an area for which a histogram will be generated. The height of the peaks of the histogram is directly related to the volume of data with the corresponding value. Portion with Highlights Portion with Shadows Entire Image Distribution of data with a bias toward highlights. Distribution of data with a bias toward shadows. Distribution of data widely distributed between shadows and highlights. 39
-
 1
1 -
2
-
3
-
4
-
5
-
6
-
7
-
8
-
9
-
10
-
11
-
12
-
13
-
14
-
15
-
16
-
17
-
18
-
19
-
20
-
21
-
22
-
23
-
24
-
25
-
26
-
27
-
28
-
29
-
30
-
31
-
32
-
33
-
 34
34 -
 35
35 -
 36
36 -
 37
37 -
 38
38 -
 39
39 -
 40
40 -
 41
41 -
 42
42 -
 43
43 -
 44
44 -
45
-
46
-
47
-
48
-
49
-
50
-
51
-
52
-
53
-
54
-
55
-
56
-
57
-
58
-
59
-
60
-
61
-
62
-
63
-
64
-
65
-
66
-
67
-
68
-
69
-
70
-
71
 |
 |