Canon CanoScan D660U Canon Plug-in Module CS-U3.9 User's Guide - Page 42
Tone Curve Settings, Manipulating the Graph
 |
View all Canon CanoScan D660U manuals
Add to My Manuals
Save this manual to your list of manuals |
Page 42 highlights
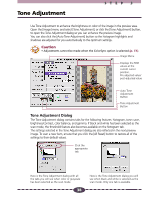
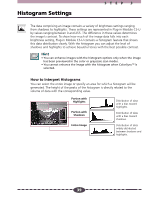
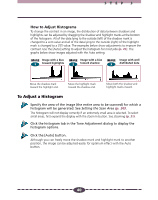
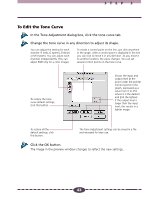
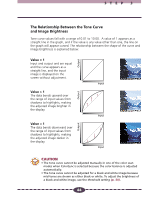
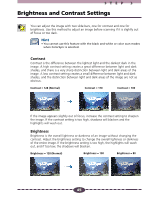
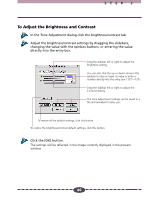
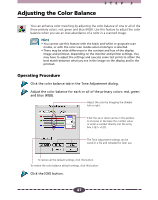
Tone Curve Settings STEP 3 You can edit the tone curve directly by changing the shape of the line on the graph. When you change the setting by manipulating the curve, you can perform fine adjustments in the brightness of only the shadows, only the highlights, or both the shadows and highlights. Hint • You cannot use this feature with the black and white or color scan modes when ColorSync is selected. Manipulating the Graph The following examples show you how to manipulate the graph to change the settings. When you test these settings yourself, you can see the changes immediately reflected in the preview window or the browser to achieve many interesting effects. OUTPUT Unadjusted Curve If you want to brighten the light areas ... Drag the mid-tones of the input side (scanned image) into the highlights of the output side (displayed image) OUTPUT INPUT INPUT Reverse the starting and end points of the line to invert shadows and highlights. OUTPUT If you want to invert the shadows and highlights ... INPUT (If the image is in color, the colors are switched to their complementary colors.) 42
-
 1
1 -
2
-
3
-
4
-
5
-
6
-
7
-
8
-
9
-
10
-
11
-
12
-
13
-
14
-
15
-
16
-
17
-
18
-
19
-
20
-
21
-
22
-
23
-
24
-
25
-
26
-
27
-
28
-
29
-
30
-
31
-
32
-
33
-
34
-
35
-
36
-
 37
37 -
 38
38 -
 39
39 -
 40
40 -
 41
41 -
 42
42 -
 43
43 -
 44
44 -
 45
45 -
 46
46 -
 47
47 -
48
-
49
-
50
-
51
-
52
-
53
-
54
-
55
-
56
-
57
-
58
-
59
-
60
-
61
-
62
-
63
-
64
-
65
-
66
-
67
-
68
-
69
-
70
-
71
 |
 |