Canon CanoScan D660U Canon Plug-in Module CS-U3.9 User's Guide - Page 43
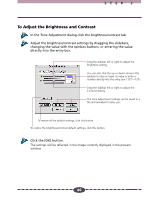
To Edit the Tone Curve, In the Tone Adjustment dialog box, click the tone curve tab.
 |
View all Canon CanoScan D660U manuals
Add to My Manuals
Save this manual to your list of manuals |
Page 43 highlights
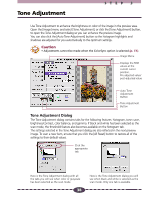
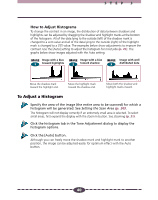
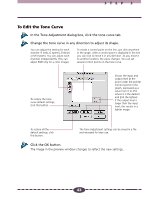
STEP 3 To Edit the Tone Curve In the Tone Adjustment dialog box, click the tone curve tab. Change the tone curve in any direction to adjust its shape. You can adjust the setting for each channel: R (red), G (green), B (blue) or M (master). You can adjust each channels independently. (You can adjust RGB only for a color image.) To create a control point on the line, just click anywhere in the graph. After a control point is displayed in the line you can click to move it in any direction. As you move it to another location, the value changes. You can set several control points on the tone curve. To restore the tone curve default settings, click this button. Shows the input and output level at the point under the pointer (control point) in the graph, expressed as a value from 0 to 255 where 0 is the darkest and 255 the lightest. If the output level is larger than the input level, this results in a lighter image. To restore all the default settings, click this button. The Tone Adjustment settings can be saved in a file and reloaded for later use. Click the OK button. The image in the preview window changes to reflect the new settings. 43
-
 1
1 -
2
-
3
-
4
-
5
-
6
-
7
-
8
-
9
-
10
-
11
-
12
-
13
-
14
-
15
-
16
-
17
-
18
-
19
-
20
-
21
-
22
-
23
-
24
-
25
-
26
-
27
-
28
-
29
-
30
-
31
-
32
-
33
-
34
-
35
-
36
-
37
-
 38
38 -
 39
39 -
 40
40 -
 41
41 -
 42
42 -
 43
43 -
 44
44 -
 45
45 -
 46
46 -
 47
47 -
 48
48 -
49
-
50
-
51
-
52
-
53
-
54
-
55
-
56
-
57
-
58
-
59
-
60
-
61
-
62
-
63
-
64
-
65
-
66
-
67
-
68
-
69
-
70
-
71
 |
 |