Canon CanoScan D660U Canon Plug-in Module CS-U3.9 User's Guide - Page 40
How to Adjust Histograms
 |
View all Canon CanoScan D660U manuals
Add to My Manuals
Save this manual to your list of manuals |
Page 40 highlights
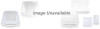
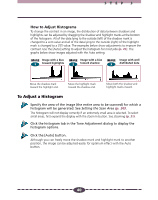
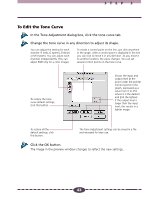
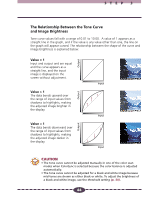
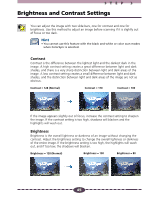
STEP 3 How to Adjust Histograms To change the contrast in an image, the distribution of data between shadows and highlights can be adjusted by dragging the shadow and highlight marks at the bottom of the histogram. All of the data lying to the outside (left) of the shadow mark is changed to a zero value and all of the data lying to the outside (right) of the highlight mark is changed to a 255 value. The examples below show adjustments to improve the contrast. Use the [Auto] setting to adjust the histogram for most jobs (p. 41). The graphs below show images adjusted with the Auto setting. IMAGE Image with a bias 1 toward highlights IMAGE Image with a bias 2 toward shadow IMAGE Image with well 3 distributed data Move the shadow mark toward the highlight end. Move the highlight mark toward the shadow end. Move both the shadow and highlight marks inward. To Adjust a Histogram Specify the area of the image (the entire area to be scanned) for which a histogram will be generated. See Setting the Scan Area (p. 30). The histogram will not display correctly if an extremely small area is selected. To select small areas, first expand the display with the Zoom In button. See Zooming (p. 31). Click the histogram tab in the Tone Adjustment dialog to display the histogram options. Click the [Auto] button. Although you can freely move the shadow mark and highlight mark to another position, the image can be adjusted easily for optimum effect with the Auto button. 40
-
 1
1 -
2
-
3
-
4
-
5
-
6
-
7
-
8
-
9
-
10
-
11
-
12
-
13
-
14
-
15
-
16
-
17
-
18
-
19
-
20
-
21
-
22
-
23
-
24
-
25
-
26
-
27
-
28
-
29
-
30
-
31
-
32
-
33
-
34
-
 35
35 -
 36
36 -
 37
37 -
 38
38 -
 39
39 -
 40
40 -
 41
41 -
 42
42 -
 43
43 -
 44
44 -
 45
45 -
46
-
47
-
48
-
49
-
50
-
51
-
52
-
53
-
54
-
55
-
56
-
57
-
58
-
59
-
60
-
61
-
62
-
63
-
64
-
65
-
66
-
67
-
68
-
69
-
70
-
71
 |
 |