Dell PowerEdge MX7000 EMC OpenManage Enterprise-Modular Edition Version 1.00.1 - Page 15
Viewing alerts, Viewing jobs and activities, Multi-chassis management dashboard, Viewing MCM home
 |
View all Dell PowerEdge MX7000 manuals
Add to My Manuals
Save this manual to your list of manuals |
Page 15 highlights
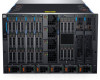
To return to the OME-Modular home page, click the OME-Modular logo or click Home. • Chassis graphical view-On left of the page, a graphical view of the front and rear chassis is displayed. It shows all the modules (sleds, fans, power supplies, IOMs, and MMs) present in the chassis. A mouse over on each module displays a brief description and health status of the module. Click View Devices to see more details about the modules present in the chassis. Click View Slot Information to switch the display of the widget to slot information list. • Slot information view-On the top left corner of the page, a list of modules present on the chassis is displayed showing slot information, health status and a link that goes into details. Modules in this list include compute, storage sleds, and IOMs. Click View Inventory to see more details about the modules present in the chassis. Click View Chassis Image to switch the display of the widget to chassis graphical view. • Chassis Information-On the lower left corner of the page, you can view a summary of the chassis information such as service tag, asset tag, firmware version and power state. • Device Health-On the upper right corner of the page, you can view the health status of chassis subsystems such as fans, power supplies, temperature and compute, networking, and storage sleds. When the subsystem status is unhealthy, you can click in the Reason to view the list of fault messages. • Recent Alerts-On the top center of the page, you can view the most recent alerts for events occurring in the chassis. Click View All, to see all the alerts in the Alerts page. • Recent Activity-Below the Recent Alerts widget, you can the most recent activities occurring in the chassis. Click View All, to view all the activities or jobs in the Jobs page. NOTE: When you refresh inventory and power the chassis on after the chassis is AC power cycled, the inventory of the compute sled and IOM may be displayed after 3-5 minutes. NOTE: If chassis has not been powered on after the AC Power Cycle operation, the inventory status is displayed as "unknown". Viewing alerts The Alerts section displays the specific types of alerts such as Critical, Warning, and Unknown. You can also view alerts for specific device types such as chassis, compute, networking, and storage. Viewing jobs and activities The Recent Activity section displays a list of recent jobs and activities, and their status. Click All Activity to go to the Jobs page and view detailed information about the jobs. Multi-chassis management dashboard Multiple chassis are grouped to form domains called Multi-Chassis Management (MCM) groups. An MCM group can have 20 chassis, where one is the lead and the remaining 19 are members. OME-Modular supports wired MCM groups where the chassis are daisy-chained through a redundant port on the management controller. In a multi-chassis management (MCM) group, the number of events and jobs for the entire group is displayed. The Device Health, Alerts, and Recent Activity sections display the consolidated details of all the devices in the group. NOTE: Maintain a minimum interval of two minutes between removing and inserting each device. Viewing MCM home page You can view the following information about the MCM group: • MCM group-You can view: - Name of the group Logging in to OME-Modular 15
-
 1
1 -
2
-
3
-
4
-
5
-
6
-
7
-
8
-
9
-
 10
10 -
 11
11 -
 12
12 -
 13
13 -
 14
14 -
 15
15 -
 16
16 -
 17
17 -
 18
18 -
 19
19 -
 20
20 -
21
-
22
-
23
-
24
-
25
-
26
-
27
-
28
-
29
-
30
-
31
-
32
-
33
-
34
-
35
-
36
-
37
-
38
-
39
-
40
-
41
-
42
-
43
-
44
-
45
-
46
-
47
-
48
-
49
-
50
-
51
-
52
-
53
-
54
-
55
-
56
-
57
-
58
-
59
-
60
-
61
-
62
-
63
-
64
-
65
-
66
-
67
-
68
-
69
-
70
-
71
-
72
-
73
-
74
-
75
-
76
-
77
-
78
-
79
-
80
-
81
-
82
-
83
-
84
-
85
-
86
-
87
-
88
-
89
-
90
-
91
-
92
-
93
-
94
-
95
-
96
 |
 |
