Dell PowerEdge MX7000 EMC OpenManage Enterprise-Modular Edition Version 1.00.1 - Page 39
Managing compute sleds, Viewing compute overview
 |
View all Dell PowerEdge MX7000 manuals
Add to My Manuals
Save this manual to your list of manuals |
Page 39 highlights
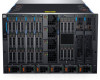
4 Managing compute sleds OME-Modular allows you to allocate and manage compute sleds to balance workload demands. You can view the list and details of compute sleds on the Compute page. The details are-health, power state, name, IP address, service tag, and model of the chassis. You can also select a compute sled to view the graphical representation and summary of the compute sled, on the right side of the Compute page. Select a compute sled from the list to view a summary of the sled on the right side. The summary includes links to launch the iDRAC and virtual consoles, name of the compute sled, device type, service tag, management IP, model, and health. If you have the Compute Manager privileges, you can perform the following tasks in this tab: • Power Control tasks: - Power Off (Non-graceful) - Power Cycle System (Cold Boot) - System Reset (Warm Boot) - Power Off (Graceful) - System Reseat - Power On • Turn-on or turn off LEDs using Blink LED. • Refresh Inventory. NOTE: When a compute sled is inserted into a chassis, sometimes the message, "No device image found", is displayed. To resolve the issue refresh the inventory of the compute sled, manually. NOTE: If the compute sled and fabric IOM mismatch, the health status of the compute or IOM is displayed as "Warning" in the chassis subsystem health. However, the health status is not displayed in the chassis graphical representation on the Chassis page, I/O Modules, and Compute pages. NOTE: Occasionally, you may see messages stating the device is offline. The messages are logged when the status poll for the device indicates that the device transitioned to "off" from "on". Topics: • Viewing compute overview • Configuring compute settings • Viewing compute hardware • Viewing compute firmware • Viewing compute hardware logs • Viewing compute alerts Viewing compute overview On the compute Overview page, you can view a graphical representation of the compute on the left side. The compute information is displayed below the graphical representation. The information includes details such as iDRAC DNS name, model, service tag, asset service tag, express service code, management IP, system up time, populated DIMM slots, and total number of DIMM slots in the compute. You can also see the operating system and location information details. Managing compute sleds 39
-
 1
1 -
2
-
3
-
4
-
5
-
6
-
7
-
8
-
9
-
10
-
11
-
12
-
13
-
14
-
15
-
16
-
17
-
18
-
19
-
20
-
21
-
22
-
23
-
24
-
25
-
26
-
27
-
28
-
29
-
30
-
31
-
32
-
33
-
 34
34 -
 35
35 -
 36
36 -
 37
37 -
 38
38 -
 39
39 -
 40
40 -
 41
41 -
 42
42 -
 43
43 -
 44
44 -
45
-
46
-
47
-
48
-
49
-
50
-
51
-
52
-
53
-
54
-
55
-
56
-
57
-
58
-
59
-
60
-
61
-
62
-
63
-
64
-
65
-
66
-
67
-
68
-
69
-
70
-
71
-
72
-
73
-
74
-
75
-
76
-
77
-
78
-
79
-
80
-
81
-
82
-
83
-
84
-
85
-
86
-
87
-
88
-
89
-
90
-
91
-
92
-
93
-
94
-
95
-
96
 |
 |
