Dell PowerEdge MX7000 EMC OpenManage Enterprise-Modular Edition Version 1.00.1 - Page 22
Creating chassis filters, Viewing chassis overview, filters
 |
View all Dell PowerEdge MX7000 manuals
Add to My Manuals
Save this manual to your list of manuals |
Page 22 highlights
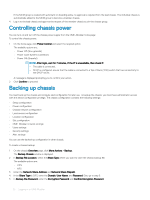
• Blink LED • Refresh chassis inventory • Filter the chassis list NOTE: When a chassis is power cycled, the inventory of the compute sleds and IOMs may be displayed in the OME-Modular web interface after three to five minutes. NOTE: Maintain a minimum interval of two minutes between removing and inserting each device. NOTE: After a chassis power off, the compute SLEDs are polled based on the event from the chassis. Each event from the chassis triggers a health-poll. You may see multiple connection loss events from compute SLEDs. Creating chassis filters You can sort the list of chassis that are displayed on the Devices > Chassis page, using filters. To create filters: On the Chassis page, click Advanced Filters to view the filter options. The following options are displayed: • Health • State • Name Contains • IP Address Contains • Service Tag Contains • Model Viewing chassis overview On the chassis Overview page, you can click View Slot Information to view the compute sled slot details. A graphical representation of the chassis is displayed on the left side. Information about the chassis is displayed below the graphical representation. The information includes FIPS status of the chassis, name, model, service tag, asset tag, express service code, management IP, firmware version, power state, and faceplate power of the chassis. Click View Devices to view the list of all devices on the All Devices page. You can also see information under the following sections: • Chassis Subsystems-Displays the health status of the chassis components such as battery, fan, IOMs, and power supply. Fabric Consistency Check (FCC) information and health change is displayed under Chassis Subsystems. But the FCC details of the compute sled are not displayed in the chassis graphical representation and the compute Overview page. • Environment-Displays the power consumption units and temperature of the chassis. Click View Power Statistics to view the chassis power consumption details such as current redundancy state, peak headroom, and system energy consumption. Click Power Usage to view the chassis power supply information on the Chassis > Hardware > Chassis Power Supplies page. If a failover or management module reboot is performed, the last reset power statistics timestamp is updated based on the failover or management module reboot timestamp. NOTE: The temperature statistics timestamp remains unchanged after a failover or management module reboot. • Recent Alerts-Displays the number and details of the tasks that are performed in the chassis. Click View All to view the list of all alerts that are related to the compute sled on the Chassis > Alerts page. • Recent Activity-Displays the status of the jobs that are performed in the compute sled. • Server Subsystems-Displays a summary of information about the server sub systems. The information includes the health status of the components such as battery, memory, processor, and voltage. If you have the Chassis Administrator privileges, you can perform the following tasks in this tab: • Power Control tasks: 22 Logging in to OME-Modular
-
 1
1 -
2
-
3
-
4
-
5
-
6
-
7
-
8
-
9
-
10
-
11
-
12
-
13
-
14
-
15
-
16
-
 17
17 -
 18
18 -
 19
19 -
 20
20 -
 21
21 -
 22
22 -
 23
23 -
 24
24 -
 25
25 -
 26
26 -
 27
27 -
28
-
29
-
30
-
31
-
32
-
33
-
34
-
35
-
36
-
37
-
38
-
39
-
40
-
41
-
42
-
43
-
44
-
45
-
46
-
47
-
48
-
49
-
50
-
51
-
52
-
53
-
54
-
55
-
56
-
57
-
58
-
59
-
60
-
61
-
62
-
63
-
64
-
65
-
66
-
67
-
68
-
69
-
70
-
71
-
72
-
73
-
74
-
75
-
76
-
77
-
78
-
79
-
80
-
81
-
82
-
83
-
84
-
85
-
86
-
87
-
88
-
89
-
90
-
91
-
92
-
93
-
94
-
95
-
96
 |
 |
