D-Link DES-3226SM Product Manual - Page 108
Network Monitoring, Port Utilization
 |
UPC - 790069247118
View all D-Link DES-3226SM manuals
Add to My Manuals
Save this manual to your list of manuals |
Page 108 highlights
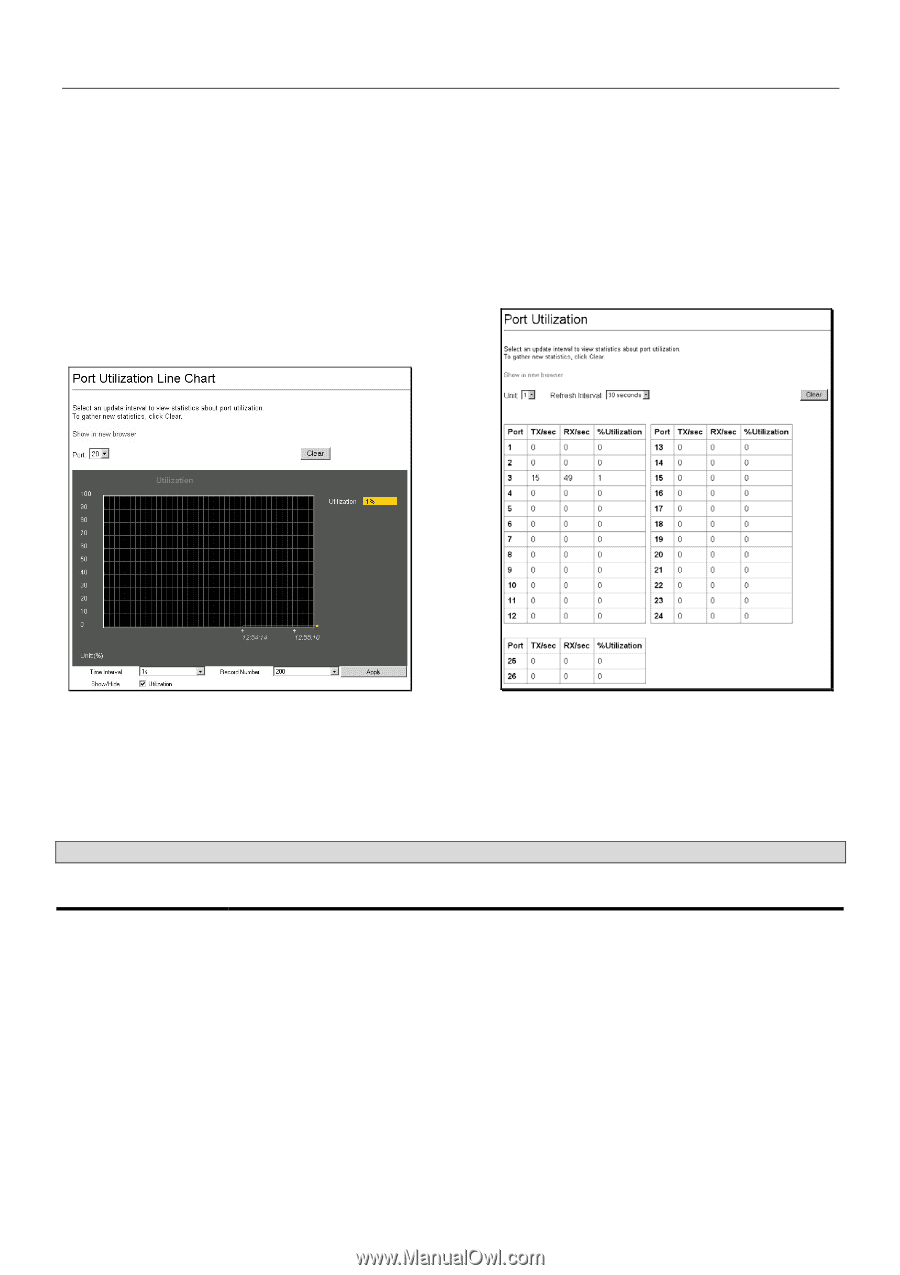
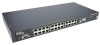
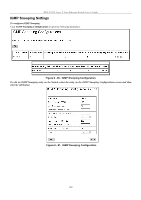
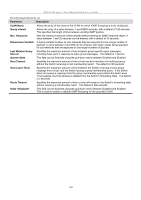
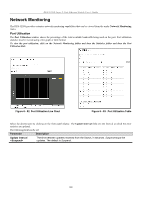
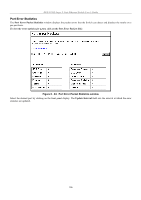
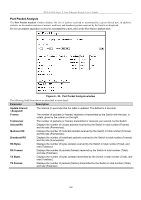
DES-3226S Layer 2 Fast Ethernet Switch User's Guide Network Monitoring The DES-3226S provides extensive network monitoring capabilities that can be viewed from the under Network Monitoring menu. Port Utilization The Port Utilization window shows the percentage of the total available bandwidth being used on the port. Port utilization statistics may be viewed using a line graph or table format. To view the port utilization, click on the Network Monitoring folder and then the Statistics folder and then the Port Utilization link: Figure 6 - 92. Port Utilization Line Chart Figure 6 - 93. Port Utilization Table Select the desired port by clicking on the front panel display. The Update Interval field sets the interval at which the error statistics are updated. The following field can be set: Parameter Description Update Interval The time between updates received from the Switch, in seconds. Suspend stops the updates. The default is Suspend. 105
-
 1
1 -
2
-
3
-
4
-
5
-
6
-
7
-
8
-
9
-
10
-
11
-
12
-
13
-
14
-
15
-
16
-
17
-
18
-
19
-
20
-
21
-
22
-
23
-
24
-
25
-
26
-
27
-
28
-
29
-
30
-
31
-
32
-
33
-
34
-
35
-
36
-
37
-
38
-
39
-
40
-
41
-
42
-
43
-
44
-
45
-
46
-
47
-
48
-
49
-
50
-
51
-
52
-
53
-
54
-
55
-
56
-
57
-
58
-
59
-
60
-
61
-
62
-
63
-
64
-
65
-
66
-
67
-
68
-
69
-
70
-
71
-
72
-
73
-
74
-
75
-
76
-
77
-
78
-
79
-
80
-
81
-
82
-
83
-
84
-
85
-
86
-
87
-
88
-
89
-
90
-
91
-
92
-
93
-
94
-
95
-
96
-
97
-
98
-
99
-
100
-
101
-
102
-
 103
103 -
 104
104 -
 105
105 -
 106
106 -
 107
107 -
 108
108 -
 109
109 -
 110
110 -
 111
111 -
 112
112 -
 113
113 -
114
-
115
-
116
-
117
-
118
-
119
-
120
-
121
-
122
-
123
-
124
 |
 |