HP 50g HP 50g_user's manual_English_HDPSG49AEM8.pdf - Page 163
population if a sample of 60 elements indicate that the mean value of the, x = 23.3
 |
UPC - 882780502291
View all HP 50g manuals
Add to My Manuals
Save this manual to your list of manuals |
Page 163 highlights
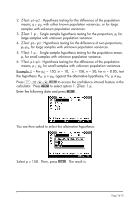
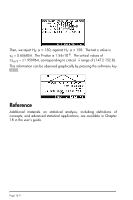
4. Z-INT: p1− p2.: Confidence interval for the difference of two proportions, p1-p2, for large samples with unknown population variances. 5. T-INT: 1 µ.: Single sample confidence interval for the population mean, µ, for small samples with unknown population variance. 6. T-INT: µ1−µ2.: Confidence interval for the difference of the population means, µ1- µ2, for small samples with unknown population variances. Example 1 - Determine the centered confidence interval for the mean of a population if a sample of 60 elements indicate that the mean value of the sample is ⎯x = 23.3, and its standard deviation is s = 5.2. Use α = 0.05. The confidence level is C = 1-α = 0.95. Select case 1 from the menu shown above by pressing @@@OK@@@. Enter the values required in the input form as shown: Press @HELP to obtain a screen explaining the meaning of the confidence interval in terms of random numbers generated by a calculator. To scroll down the resulting screen use the down-arrow key ˜. Press @@@OK@@@ when done with the help screen. This will return you to the screen shown above. To calculate the confidence interval, press @@@OK@@@. The result shown in the calculator is: Press @GRAPH to see a graphical display of the confidence interval information: Page 16-8
-
 1
1 -
2
-
3
-
4
-
5
-
6
-
7
-
8
-
9
-
10
-
11
-
12
-
13
-
14
-
15
-
16
-
17
-
18
-
19
-
20
-
21
-
22
-
23
-
24
-
25
-
26
-
27
-
28
-
29
-
30
-
31
-
32
-
33
-
34
-
35
-
36
-
37
-
38
-
39
-
40
-
41
-
42
-
43
-
44
-
45
-
46
-
47
-
48
-
49
-
50
-
51
-
52
-
53
-
54
-
55
-
56
-
57
-
58
-
59
-
60
-
61
-
62
-
63
-
64
-
65
-
66
-
67
-
68
-
69
-
70
-
71
-
72
-
73
-
74
-
75
-
76
-
77
-
78
-
79
-
80
-
81
-
82
-
83
-
84
-
85
-
86
-
87
-
88
-
89
-
90
-
91
-
92
-
93
-
94
-
95
-
96
-
97
-
98
-
99
-
100
-
101
-
102
-
103
-
104
-
105
-
106
-
107
-
108
-
109
-
110
-
111
-
112
-
113
-
114
-
115
-
116
-
117
-
118
-
119
-
120
-
121
-
122
-
123
-
124
-
125
-
126
-
127
-
128
-
129
-
130
-
131
-
132
-
133
-
134
-
135
-
136
-
137
-
138
-
139
-
140
-
141
-
142
-
143
-
144
-
145
-
146
-
147
-
148
-
149
-
150
-
151
-
152
-
153
-
154
-
155
-
156
-
157
-
 158
158 -
 159
159 -
 160
160 -
 161
161 -
 162
162 -
 163
163 -
 164
164 -
 165
165 -
 166
166 -
 167
167 -
 168
168 -
169
-
170
-
171
-
172
-
173
-
174
-
175
-
176
-
177
-
178
-
179
-
180
-
181
-
182
-
183
-
184
 |
 |
