HP 50g HP 50g_user's manual_English_HDPSG49AEM8.pdf - Page 164
Hypothesis testing
 |
UPC - 882780502291
View all HP 50g manuals
Add to My Manuals
Save this manual to your list of manuals |
Page 164 highlights
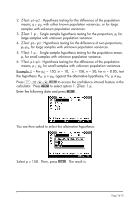
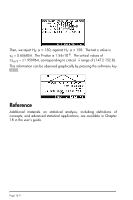
The graph shows the standard normal distribution pdf (probability density function), the location of the critical points ±zα/2, the mean value (23.3) and the corresponding interval limits (21.98424 and 24.61576). Press @TEXT to return to the previous results screen, and/or press @@@OK@@@ to exit the confidence interval environment. The results will be listed in the calculator's display. Additional examples of confidence interval calculations are presented in Chapter 18 in the calculator's user's guide. Hypothesis testing A hypothesis is a declaration made about a population (for instance, with respect to its mean). Acceptance of the hypothesis is based on a statistical test on a sample taken from the population. The consequent action and decision-making are called hypothesis testing. The calculator provides hypothesis testing procedures under application 5. Hypoth. tests.. can be accessed by using ,Ù--@@@OK@@@. As with the calculation of confidence intervals, discussed earlier, this program offers the following 6 options: These options are interpreted as in the confidence interval applications: 1. Z-Test: 1 µ.: Single sample hypothesis testing for the population mean, µ, with known population variance, or for large samples with unknown population variance. Page 16-9
-
 1
1 -
2
-
3
-
4
-
5
-
6
-
7
-
8
-
9
-
10
-
11
-
12
-
13
-
14
-
15
-
16
-
17
-
18
-
19
-
20
-
21
-
22
-
23
-
24
-
25
-
26
-
27
-
28
-
29
-
30
-
31
-
32
-
33
-
34
-
35
-
36
-
37
-
38
-
39
-
40
-
41
-
42
-
43
-
44
-
45
-
46
-
47
-
48
-
49
-
50
-
51
-
52
-
53
-
54
-
55
-
56
-
57
-
58
-
59
-
60
-
61
-
62
-
63
-
64
-
65
-
66
-
67
-
68
-
69
-
70
-
71
-
72
-
73
-
74
-
75
-
76
-
77
-
78
-
79
-
80
-
81
-
82
-
83
-
84
-
85
-
86
-
87
-
88
-
89
-
90
-
91
-
92
-
93
-
94
-
95
-
96
-
97
-
98
-
99
-
100
-
101
-
102
-
103
-
104
-
105
-
106
-
107
-
108
-
109
-
110
-
111
-
112
-
113
-
114
-
115
-
116
-
117
-
118
-
119
-
120
-
121
-
122
-
123
-
124
-
125
-
126
-
127
-
128
-
129
-
130
-
131
-
132
-
133
-
134
-
135
-
136
-
137
-
138
-
139
-
140
-
141
-
142
-
143
-
144
-
145
-
146
-
147
-
148
-
149
-
150
-
151
-
152
-
153
-
154
-
155
-
156
-
157
-
158
-
 159
159 -
 160
160 -
 161
161 -
 162
162 -
 163
163 -
 164
164 -
 165
165 -
 166
166 -
 167
167 -
 168
168 -
 169
169 -
170
-
171
-
172
-
173
-
174
-
175
-
176
-
177
-
178
-
179
-
180
-
181
-
182
-
183
-
184
 |
 |
