HP Cisco Nexus 5000 Cisco MDS 9000 Family Fabric Manager Quick Configuration G - Page 46
Fabric Manager Client Quick Tour
 |
View all HP Cisco Nexus 5000 manuals
Add to My Manuals
Save this manual to your list of manuals |
Page 46 highlights
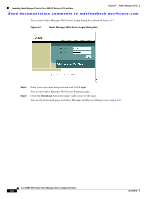
Fabric Manager Client Quick Tour Chapter 4 Fabric Manager Client Send documentation comments to [email protected] Fabric Manager Client Quick Tour This section helps you get familiar with the various icons and sections that enable navigation in the Fabric Manager Client interface, as shown in Figure 4-7. Figure 4-7 Fabric Manager Main Window 1 Menu bar-Provides access to options that are organized by menus. 2 Toolbar-Provides icons to access the most commonly used options on the File, Tools, and Help menus. 3 Information pane-Displays information about whatever option is selected in the menu tree. 4 Status bar (right side)-Shows the last entry displayed by the discovery process, and the possible error message. 5 Fabric pane-Displays a map of the network fabric, including switches, hosts, and storage. It also provides tabs for displaying log and event data. 6 Logical domains-Displays a tree of configured SANs, fabrics, VSANs, and zones. 7 Physical attributes-Displays a tree of available configuration tasks depending on the SAN, fabric, VSAN, or zone selected above. Lists the switches and end devices in the logical selection. 8 Status Bar (left side)-Shows short-term transient messages, such as the number of rows displayed in a table. Cisco MDS 9000 Family Fabric Manager Quick Configuration Guide 4-6 OL-7765-06
-
 1
1 -
2
-
3
-
4
-
5
-
6
-
7
-
8
-
9
-
10
-
11
-
12
-
13
-
14
-
15
-
16
-
17
-
18
-
19
-
20
-
21
-
22
-
23
-
24
-
25
-
26
-
27
-
28
-
29
-
30
-
31
-
32
-
33
-
34
-
35
-
36
-
37
-
38
-
39
-
40
-
 41
41 -
 42
42 -
 43
43 -
 44
44 -
 45
45 -
 46
46 -
 47
47 -
 48
48 -
 49
49 -
 50
50 -
 51
51 -
52
-
53
-
54
-
55
-
56
-
57
-
58
-
59
-
60
-
61
-
62
-
63
-
64
-
65
-
66
-
67
-
68
-
69
-
70
-
71
-
72
-
73
-
74
-
75
-
76
-
77
-
78
-
79
-
80
-
81
-
82
-
83
-
84
-
85
-
86
-
87
-
88
 |
 |
