HP Cisco Nexus 5000 Cisco MDS 9000 Family Fabric Manager Quick Configuration G - Page 54

Status Bar, Context Menus, Filtering, traceroute, Device, Manager

Page 54 highlights

Fabric Manager Client Quick Tour Chapter 4 Fabric Manager Client Send documentation comments to [email protected] • Security-View and configure MDS management and FC-SP security. • ISLs-View and configure Inter-Switch Links. • End Devices-View and configure end devices. Status Bar The status bar at the bottom of the Fabric Manager window shows the last entry displayed by the discovery process, and the possible error message on the right side. The status bar displays a message stating that something has changed in the fabric and a new discovery is needed. The status bar shows both short-term, transient messages (such as the number of rows displayed in the table) and long-term discovery issues. Context Menus When you right-click an icon in the Fabric pane, you see a pop-up menu with options that vary depending on the type of icon selected. The various options available for different objects include the following: • Open an instance of Device Manager for the selected switch. • Open a CLI session for the selected switch. • Copy the display name of the selected object. • Execute a ping or traceroute command for the device. • Show or hide end devices. • View attributes. • Quiesce and disable members for PortChannels. • Set the trunking mode for an ISL. • Create or add to a PortChannel for selected ISLs. The Fabric pane has its own toolbar with options for saving, printing, and changing the appearance of the map. When you right-click on the map, a pop-up menu appears that provides options (duplicated on the toolbar) for changing the appearance of the map. Note You can launch web-based or non-web-based applications from the Fabric pane. Assign an IP address to the storage port or enclosure, and then right-click to bring up the pop-up menu, and select Device Manager. Filtering Fabric Manager has a built-in filtering mechanism that displays only the data that you are interested in. To filter, first select the SAN, fabric, and VSAN from the Logical Domains pane to narrow the scope of what is displayed in the Fabric pane. Any information that does not belong to the selected items is dimmed. Also, any information that does not belong to the selected items is not displayed in the tables in the Information pane. To further narrow the scope, select attributes from the Physical Attributes pane. The Fabric Manager tables, display, and filter criteria change accordingly. 4-14 Cisco MDS 9000 Family Fabric Manager Quick Configuration Guide OL-7765-06

  • 1
  • 2
  • 3
  • 4
  • 5
  • 6
  • 7
  • 8
  • 9
  • 10
  • 11
  • 12
  • 13
  • 14
  • 15
  • 16
  • 17
  • 18
  • 19
  • 20
  • 21
  • 22
  • 23
  • 24
  • 25
  • 26
  • 27
  • 28
  • 29
  • 30
  • 31
  • 32
  • 33
  • 34
  • 35
  • 36
  • 37
  • 38
  • 39
  • 40
  • 41
  • 42
  • 43
  • 44
  • 45
  • 46
  • 47
  • 48
  • 49
  • 50
  • 51
  • 52
  • 53
  • 54
  • 55
  • 56
  • 57
  • 58
  • 59
  • 60
  • 61
  • 62
  • 63
  • 64
  • 65
  • 66
  • 67
  • 68
  • 69
  • 70
  • 71
  • 72
  • 73
  • 74
  • 75
  • 76
  • 77
  • 78
  • 79
  • 80
  • 81
  • 82
  • 83
  • 84
  • 85
  • 86
  • 87
  • 88

Send documentation comments to [email protected]
4-14
Cisco MDS 9000 Family Fabric Manager Quick Configuration Guide
OL-7765-06
Chapter 4
Fabric Manager Client
Fabric Manager Client Quick Tour
Security—View and configure MDS management and FC-SP security.
ISLs—View and configure Inter-Switch Links.
End Devices—View and configure end devices.
Status Bar
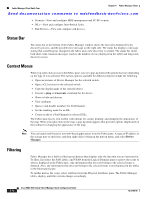
The status bar at the bottom of the Fabric Manager window shows the last entry displayed by the
discovery process, and the possible error message on the right side. The status bar displays a message
stating that something has changed in the fabric and a new discovery is needed. The status bar shows
both short-term, transient messages (such as the number of rows displayed in the table) and long-term
discovery issues.
Context Menus
When you right-click an icon in the Fabric pane, you see a pop-up menu with options that vary depending
on the type of icon selected. The various options available for different objects include the following:
Open an instance of Device Manager for the selected switch.
Open a CLI session for the selected switch.
Copy the display name of the selected object.
Execute a
ping
or
traceroute
command for the device.
Show or hide end devices.
View attributes.
Quiesce and disable members for PortChannels.
Set the trunking mode for an ISL.
Create or add to a PortChannel for selected ISLs.
The Fabric pane has its own toolbar with options for saving, printing, and changing the appearance of
the map. When you right-click on the map, a pop-up menu appears that provides options (duplicated on
the toolbar) for changing the appearance of the map.
Note
You can launch web-based or non-web-based applications from the Fabric pane. Assign an IP address to
the storage port or enclosure, and then right-click to bring up the pop-up menu, and select
Device
Manager
.
Filtering
Fabric Manager has a built-in filtering mechanism that displays only the data that you are interested in.
To filter, first select the SAN, fabric, and VSAN from the Logical Domains pane to narrow the scope of
what is displayed in the Fabric pane. Any information that does not belong to the selected items is
dimmed. Also, any information that does not belong to the selected items is not displayed in the tables
in the Information pane.
To further narrow the scope, select attributes from the Physical Attributes pane. The Fabric Manager
tables, display, and filter criteria change accordingly.