Dell Fabric Manager Dell Fabric Manager Deployment Guide 1.0.0 - Page 49
Modifying and Viewing the Distributed Core, Dashboard
 |
View all Dell Fabric Manager manuals
Add to My Manuals
Save this manual to your list of manuals |
Page 49 highlights
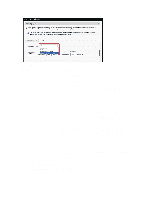
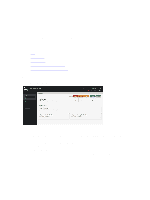
Modifying and Viewing the Distributed Core This section contains the following topics: • Dashboard • Cores • Editing the Core • Deleting the Core • Viewing and Exporting Wiring Diagram • Viewing the Core DHCP Configuration File Dashboard Use the Home > Dashboard screen as shown below to view the distributed core and system health. 10 This screen provides the following information about key performance: • System/Network Health-Provides a tabular listing of system and distributed cores being managed by the system and lists the corresponding alert count by severity. The Node Health column displays the number of nodes that are alert free and the total nodes that are part of the distributed core. • Top 5 Highest Memory Utilization-Displays the top 5 switches whose memory utilization is the most across all the distributed cores. • Top Link Usage-Displays the top 10 link ports whose link use is the most across all the distributed cores. • Highest CPU Utilization-Displays the top 5 switches whose CPU utilization is the most across all the distributed cores. Related links: • Alerts • Monitor 49
-
 1
1 -
2
-
3
-
4
-
5
-
6
-
7
-
8
-
9
-
10
-
11
-
12
-
13
-
14
-
15
-
16
-
17
-
18
-
19
-
20
-
21
-
22
-
23
-
24
-
25
-
26
-
27
-
28
-
29
-
30
-
31
-
32
-
33
-
34
-
35
-
36
-
37
-
38
-
39
-
40
-
41
-
42
-
43
-
 44
44 -
 45
45 -
 46
46 -
 47
47 -
 48
48 -
 49
49 -
 50
50 -
 51
51 -
 52
52 -
 53
53 -
 54
54 -
55
-
56
-
57
-
58
-
59
-
60
-
61
-
62
-
63
-
64
-
65
 |
 |
