HP 11kVA 400 Volt IEC309 16A 3-Phase Input 30xC13/3xC19 HP Monitored Power Dis - Page 64
Active Alarms, Review Active Alarms, Logs, Clear the Event Log
 |
View all HP 11kVA 400 Volt IEC309 16A 3-Phase Input 30xC13/3xC19 manuals
Add to My Manuals
Save this manual to your list of manuals |
Page 64 highlights
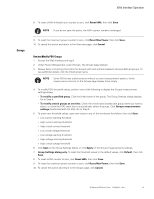
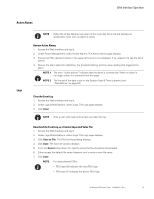
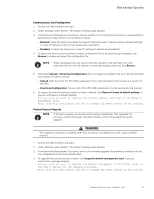
Web Interface Operation Active Alarms Logs NOTE When the Active Alarms menu item in the menu bar list is red and displays an exclamation mark icon, an alarm is active. Review Active Alarms 1. Access the Web interface and log in. 2. Under Power Management, select Active Alarms. The Active Alarms page displays. 3. Ensure the PDU operation button in the upper left corner is not collapsed. If so, expand it to see the list of alarms. 4. Review the alarm detection date/time, the threshold setting, and the value reading that triggered the alarm. NOTE 1 The term "active alarms" indicates that the alarm is currently set. When an alarm is no longer active, it is removed from this page. NOTE 2 The format of the date is set on the System Date & Time submenu (see "Date &Time" on page 64). Clear the Event Log 1. Access the Web interface and log in. 2. Under Logs & Notifications, select Logs. The Logs page displays. 3. Click Clear. NOTE Only a user with read-write access can clear the log. Download the Event Log as a Comma Separated Value File 1. Access the Web interface and log in. 2. Under Logs & Notifications, select Logs. The Logs page displays. 3. Click Save to File. The File Download dialog displays. 4. Click Save. The Save As window displays. 5. From the Save in drop-down list, specify where the file should be downloaded. 6. Either accept the default file name (logevent.csv) or enter a new file name. 7. Click Save. NOTE For daisy-chained PDUs: l PDU type 00 indicates the host PDU logs. l PDU type 01 indicates the device PDU logs. HP Monitored PDU User's Guide P-164000281-Rev 1 58
-
 1
1 -
2
-
3
-
4
-
5
-
6
-
7
-
8
-
9
-
10
-
11
-
12
-
13
-
14
-
15
-
16
-
17
-
18
-
19
-
20
-
21
-
22
-
23
-
24
-
25
-
26
-
27
-
28
-
29
-
30
-
31
-
32
-
33
-
34
-
35
-
36
-
37
-
38
-
39
-
40
-
41
-
42
-
43
-
44
-
45
-
46
-
47
-
48
-
49
-
50
-
51
-
52
-
53
-
54
-
55
-
56
-
57
-
58
-
 59
59 -
 60
60 -
 61
61 -
 62
62 -
 63
63 -
 64
64 -
 65
65 -
 66
66 -
 67
67 -
 68
68 -
 69
69 -
70
-
71
-
72
-
73
-
74
-
75
-
76
-
77
-
78
-
79
-
80
-
81
-
82
-
83
-
84
-
85
-
86
-
87
-
88
-
89
-
90
-
91
-
92
-
93
-
94
-
95
-
96
-
97
-
98
-
99
-
100
-
101
-
102
-
103
-
104
-
105
-
106
-
107
-
108
-
109
-
110
-
111
-
112
-
113
-
114
-
115
-
116
-
117
-
118
-
119
-
120
 |
 |
