HP Brocade 8/12c Brocade Fabric OS Troubleshooting and Diagnostics Guide v6.2. - Page 101
Deleting a configuration for a tunnel, Displaying FTRACE for a tunnel
 |
View all HP Brocade 8/12c manuals
Add to My Manuals
Save this manual to your list of manuals |
Page 101 highlights
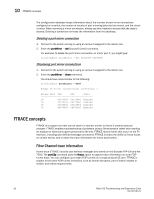
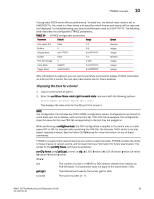
FTRACE concepts 10 Deleting a configuration for a tunnel 1. Log on to the switch as admin. 2. Enter the portCfg ftrace [slot/]Ge_Port tunnel_Id del command. switch:admin> portcfg ftrace ge1 1 del This deletes the FTRACE configuration for GigE 1, tunnel 1. Displaying FTRACE for a tunnel The portShow command uses the ftrace option to display a trace for a tunnel. Use the following syntax to display a trace: portShow ftrace [slot/]Ge_Port tunnel_Id [FeatureArgs] Example of Capturing an FTRACE on a GE tunnel This process defines how to capture an FTRACE buffer, save it, and then enter the supportSave command that includes that data. 1. Enable FTRACE on ge1 interface tunnel 0 using the default parameters: switch:admin> portcfg ftrace ge1 0 cfg -e 1 NOTE The -e 1 enables FTRACE with all of the default options. There may be times that the default parameters must be modified to capture more information. 2. Verify an FTRACE has occurred To verify if an FTRACE was generated on ge1 tunnel 0, issue the portShow ftrace ge1 0 stats command. You will notice the status of buffer ID 0 changed from Current to Triggered. The status of buffer 1 will change from unused to Current. | | | |Trace Header| Wrap | In | Out | Switch | Switch | | Id | State | Size | Address | Count | OXID | OXID | Date | Time | | 0 | Triggered | 200000 | 0x10010000 | 65 | FFFF | FFFF | 04/23/2008 | 23:14:14 | | 1| Current | 200000 | 0x10010100 | 0 | FFFF | FFFF | | | | 2| unused | 200000 | 0x10010200 | 0 | FFFF | FFFF | | | | 3| unused | 200000 | 0x10010300 | 0 | FFFF | FFFF | | | NOTE If there are multiple Triggered events, capture and manage them all in the procedures to follow. 3. Save an FTRACE to the blade processor (BP). The following command is used to save ge1 tunnel 0 buffer ID 0 to the BP: switch:admin> portshow ftrace ge1 0 save 0 Fabric OS Troubleshooting and Diagnostics Guide 85 53-1001187-01
-
 1
1 -
2
-
3
-
4
-
5
-
6
-
7
-
8
-
9
-
10
-
11
-
12
-
13
-
14
-
15
-
16
-
17
-
18
-
19
-
20
-
21
-
22
-
23
-
24
-
25
-
26
-
27
-
28
-
29
-
30
-
31
-
32
-
33
-
34
-
35
-
36
-
37
-
38
-
39
-
40
-
41
-
42
-
43
-
44
-
45
-
46
-
47
-
48
-
49
-
50
-
51
-
52
-
53
-
54
-
55
-
56
-
57
-
58
-
59
-
60
-
61
-
62
-
63
-
64
-
65
-
66
-
67
-
68
-
69
-
70
-
71
-
72
-
73
-
74
-
75
-
76
-
77
-
78
-
79
-
80
-
81
-
82
-
83
-
84
-
85
-
86
-
87
-
88
-
89
-
90
-
91
-
92
-
93
-
94
-
95
-
 96
96 -
 97
97 -
 98
98 -
 99
99 -
 100
100 -
 101
101 -
 102
102 -
 103
103 -
 104
104 -
 105
105 -
 106
106 -
107
-
108
-
109
-
110
-
111
-
112
-
113
-
114
-
115
-
116
-
117
-
118
-
119
-
120
-
121
-
122
-
123
-
124
-
125
-
126
-
127
-
128
-
129
-
130
-
131
-
132
-
133
-
134
-
135
-
136
-
137
-
138
-
139
-
140
-
141
-
142
-
143
-
144
 |
 |