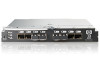
HP Brocade 8/12c Brocade Fabric OS Troubleshooting and Diagnostics Guide v6.2. - Page 99
Displaying the trace for a tunnel, Fabric OS Reference, tunnel_Id, value
 |
View all HP Brocade 8/12c manuals
Add to My Manuals
Save this manual to your list of manuals |
Page 99 highlights
FTRACE concepts 10 Tracing every FICON event affects performance. To avoid this, the default trace mask is set to 0x80000C7b. The mask is a filter where a bit specifies which frames and events will be captured and displayed. For troubleshooting, you should set the trace mask to 0-0xFFFFFFFF. The following table describes the configurable FTRACE parameters. TABLE 14 FTRACE configurable parameters Parameter Default Range Syntax Auto check Out Buffers Display Mask Enable Post Percentage Trace Mask Trigger Mask False 0 0xFFFFFFFF False 5 0x8000 0x80000d7b T/F 0-8 0-0xFFFFFFFF T/F 0-100 0-0xFFFFFFFF 0-0xFFFFFFFF Boolean Integer Integer Boolean Integer Integer Integer After information is captured, you can use the portshow command to display FTRACE information on a GE port for a tunnel. You can save trace events can for future analysis. Displaying the trace for a tunnel 1. Log on to the switch as admin. 2. Enter the portShow ftrace /geX tunnelId stats command with the following options: switch:admin> portshow ftrace ge0 1 stats This displays the trace stats for the GE port 0 for tunnel 1. NOTE The configuration file includes key FCIP FTRACE configuration values. Configurations are stored on a slot basis and not on blades, such as the FR4-18i. If the FR4-18i is swapped, the configuration stays the same for the new FR4-18i corresponding to the slot they are plugged in. When performing a configDownload, the FCIP configuration is applied to the switch only on a slot power OFF or ON, for example slots containing the FR4-18i. The Brocade 7500, which is not slot based, requires a reboot. See the Fabric OS Reference for more information on any of these commands. FTRACE is a support tool used primarily by your switch support provider. FTRACE includes the ability to freeze traces on certain events, and to retain the trace information for future examination. The syntax for the portCfg ftrace command is as follows: portCfg ftrace [slot/]ge0|ge1 tunnel_Id cfg [-a 1|0] [-b value] [-e 1|0] [-i value] [-p value] [-r value] [-s value] [-t value] [-z value] Where: slot The number of a slot in a 48000 or DCX director chassis that contains an FC4-18i blade. This parameter does not apply to the stand-alone 7500. ge0|ge1 The Ethernet port used by the tunnel (ge0 or Ge1). tunnelid The tunnel number (0 - 7). Fabric OS Troubleshooting and Diagnostics Guide 83 53-1001187-01
-
 1
1 -
2
-
3
-
4
-
5
-
6
-
7
-
8
-
9
-
10
-
11
-
12
-
13
-
14
-
15
-
16
-
17
-
18
-
19
-
20
-
21
-
22
-
23
-
24
-
25
-
26
-
27
-
28
-
29
-
30
-
31
-
32
-
33
-
34
-
35
-
36
-
37
-
38
-
39
-
40
-
41
-
42
-
43
-
44
-
45
-
46
-
47
-
48
-
49
-
50
-
51
-
52
-
53
-
54
-
55
-
56
-
57
-
58
-
59
-
60
-
61
-
62
-
63
-
64
-
65
-
66
-
67
-
68
-
69
-
70
-
71
-
72
-
73
-
74
-
75
-
76
-
77
-
78
-
79
-
80
-
81
-
82
-
83
-
84
-
85
-
86
-
87
-
88
-
89
-
90
-
91
-
92
-
93
-
 94
94 -
 95
95 -
 96
96 -
 97
97 -
 98
98 -
 99
99 -
 100
100 -
 101
101 -
 102
102 -
 103
103 -
 104
104 -
105
-
106
-
107
-
108
-
109
-
110
-
111
-
112
-
113
-
114
-
115
-
116
-
117
-
118
-
119
-
120
-
121
-
122
-
123
-
124
-
125
-
126
-
127
-
128
-
129
-
130
-
131
-
132
-
133
-
134
-
135
-
136
-
137
-
138
-
139
-
140
-
141
-
142
-
143
-
144
 |
 |