HP Brocade 8/12c Brocade Fabric OS Troubleshooting and Diagnostics Guide v6.2. - Page 120
Displaying the uptime for a switch, Chassis-level diagnostics
 |
View all HP Brocade 8/12c manuals
Add to My Manuals
Save this manual to your list of manuals |
Page 120 highlights
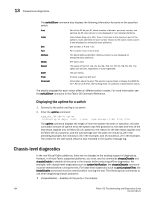
13 Chassis-level diagnostics The switchShow command also displays the following information for ports on the specified switch: Area Index Slot Port Address Media Speed State Proto Comment Part of the 24-bit port ID, which consists of domain, port area number, and optional AL_PA. Area column is only displayed on non-modular platforms. Index follows Area up to 255. Then it continues to the maximum port of the platform. Index identifies the port number relative to the switch. Index column is only displayed on enterprise-class platforms. Slot number; 1-4 and 7-10. Port number; 0-15, 0-31 or 0-47. The 24-bit Address Identifier. Address column is only displayed on enterprise-class platforms. SFP types used. The speed of the Port (1G, 2G, 4G, 8G, 10G, N1, N2, N4, N8, AN, UN). The speed can be fixed, negotiated, or auto-negotiated. The port status. Protocol support by GbE port. Information about the port. This section may be blank or display the WWN for an F_Port or an E_Port, the trunking state, or upstream or downstream status. The details displayed for each switch differ on different switch models. For more information see the switchShow command in the Fabric OS Command Reference. Displaying the uptime for a switch 1. Connect to the switch and log in as admin. 2. Enter the uptime command: supp_dcx_184:admin> uptime 10:50:19 up 11 days, 6:28, 1 user, load average: 0.49, 0.53, 0.54 The uptime command displays the length of time the system has been in operation, the total cumulative amount of uptime since the system was first powered-on, the date and time of the last reboot (applies only to Fabric OS v3.x systems), the reason for the last reboot (applies only to Fabric OS v3.x systems), and the load average over the past one minute (1.29 in the preceding example), five minutes (1.31 in the example), and 15 minutes (1.27 in the example). The reason for the last switch reboot is also recorded in the system message log. Chassis-level diagnostics In the non-Virtual Fabric platforms, there are no changes to the existing support of diagnostics. However, in Virtual Fabric supported platforms, you must use the commands chassisDisable and chassisEnable to disable all the ports in the chassis before executing offline diagnostics. For example, with chassis-level diagnostics such as systemVerification, the chassisDisable command must be entered before running the test. For blade-level diagnostics such as portLoopbackTest, the bladeDisable command must be entered before running the test. The following lists commands to use when diagnosing chassis problems: • chassisDisable - disables all the ports in the chassis 104 Fabric OS Troubleshooting and Diagnostics Guide 53-1001187-01
-
 1
1 -
2
-
3
-
4
-
5
-
6
-
7
-
8
-
9
-
10
-
11
-
12
-
13
-
14
-
15
-
16
-
17
-
18
-
19
-
20
-
21
-
22
-
23
-
24
-
25
-
26
-
27
-
28
-
29
-
30
-
31
-
32
-
33
-
34
-
35
-
36
-
37
-
38
-
39
-
40
-
41
-
42
-
43
-
44
-
45
-
46
-
47
-
48
-
49
-
50
-
51
-
52
-
53
-
54
-
55
-
56
-
57
-
58
-
59
-
60
-
61
-
62
-
63
-
64
-
65
-
66
-
67
-
68
-
69
-
70
-
71
-
72
-
73
-
74
-
75
-
76
-
77
-
78
-
79
-
80
-
81
-
82
-
83
-
84
-
85
-
86
-
87
-
88
-
89
-
90
-
91
-
92
-
93
-
94
-
95
-
96
-
97
-
98
-
99
-
100
-
101
-
102
-
103
-
104
-
105
-
106
-
107
-
108
-
109
-
110
-
111
-
112
-
113
-
114
-
 115
115 -
 116
116 -
 117
117 -
 118
118 -
 119
119 -
 120
120 -
 121
121 -
 122
122 -
 123
123 -
 124
124 -
 125
125 -
126
-
127
-
128
-
129
-
130
-
131
-
132
-
133
-
134
-
135
-
136
-
137
-
138
-
139
-
140
-
141
-
142
-
143
-
144
 |
 |
