HP dc73 HP Blade Workstation Solution Planning Guide - Page 25
Roundtrip, Latency, Subjective impact, Behaviors, Network hops, Geographic distance
 |
View all HP dc73 manuals
Add to My Manuals
Save this manual to your list of manuals |
Page 25 highlights
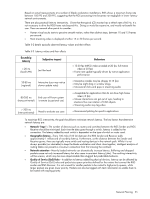
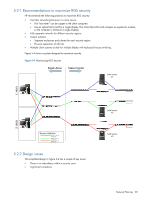
Based on actual measurements at a number of blade workstation installations, RGS shows a maximum frame rate between 150 FPS and 200 FPS, suggesting that the RGS processing time becomes non-negligible in lower- latency network environments. There are also practical limits to interactivity. Given that the typical LCD monitor has a refresh rate of 60 Hz, it is not necessary to drive the RGS frame rate beyond this. Doing so would be expensive, and would not benefit the user. There are several other points to consider: • Human visual acuity starts to perceive smooth motion, rather than distinct steps, between 10 and 15 frames per second. • Most streaming video is displayed at either 15 or 30 frames per second. Table 5-2 details typically observed latency values and their effects Table 5-2 Latency values and their effects Roundtrip Latency Subjective impact < 20 ms (local LAN) Just like local 20-80 ms (regional) Interactive (user may notice slower update rates) 80-200 ms End user will know system (transcontinental) is remote (occasional use) > 200 ms (intercontinental) Need to evaluate use case Behaviors • 15-30 fps (MPEG video encoded at 20 fps; full motion video at 30 fps) • Frame rate update typically driven by native application performance • Interactive models may be choppy (5-15 fps) • May be slight drag in window drags • Occasional clicks and pops in streaming audio • Acceptable for applications that do not drive high frame rates (
-
 1
1 -
2
-
3
-
4
-
5
-
6
-
7
-
8
-
9
-
10
-
11
-
12
-
13
-
14
-
15
-
16
-
17
-
18
-
19
-
 20
20 -
 21
21 -
 22
22 -
 23
23 -
 24
24 -
 25
25 -
 26
26 -
 27
27 -
 28
28 -
 29
29 -
 30
30 -
31
-
32
-
33
-
34
-
35
 |
 |