HP dc73 HP Blade Workstation Solution Planning Guide - Page 4

s, Tables - blade workstation

Page 4 highlights

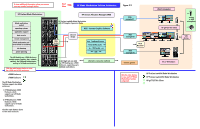
5-5-1 Characterizing latency...32 5-5-2 Characterizing RGS bandwidth consumption 34 5-6 Network summary...35 Figures Figure 1-1 HP Blade Workstation Solution documentation hierarchy 5 Figure 3-1 When viewed electronically, the rounded rectangles are buttons which generate mouse-over popup text boxes...8 Figure 3-2 The HP Blade Workstation Solution architecture 9 Figure 3-3 iLO 2 status summary ...11 Figure 3-4 Boot console ...12 Figure 3-5 Connecting virtual media to the blade workstation 12 Figure 3-6 c7000 enclosure front and rear views provided by Onboard Administrator 18 Figure 4-1 Recommended blade workstation solution deployment steps 20 Figure 5-1 The RGS performance triad...23 Figure 5-2 Network traffic between the RGS Sender and Receiver 24 Figure 5-3 Separation of RGS traffic from data traffic 26 Figure 5-4 Maximizing RGS security ...28 Figure 5-5 Maximizing RGS reliability ...29 Figure 5-6 Typical network layers in an enterprise-class network 30 Figure 5-7 Latency and bandwidth consumption 31 Figure 5-8 Bing command sample output ...32 Figure 5-9 Ethereal sample screen...33 Figure 5-10 Performance monitoring ...34 Tables Table 5-1 RGS frame rate for different network latencies when Rgreceiver.MaxImageUpdateRequests=1.... 24 Table 5-2 Latency values and their effects...25 Table 5-3 Typical bandwidth consumption for a 100 Mb/s network 34 Figures 4

  • 1
  • 2
  • 3
  • 4
  • 5
  • 6
  • 7
  • 8
  • 9
  • 10
  • 11
  • 12
  • 13
  • 14
  • 15
  • 16
  • 17
  • 18
  • 19
  • 20
  • 21
  • 22
  • 23
  • 24
  • 25
  • 26
  • 27
  • 28
  • 29
  • 30
  • 31
  • 32
  • 33
  • 34
  • 35

Figures
4
5-5-1
Characterizing latency
........................................................................................................
32
5-5-2
Characterizing RGS bandwidth consumption
.........................................................................
34
5-6
Network summary
........................................................................................................................
35
Figures
Figure 1-1
HP Blade Workstation Solution documentation hierarchy
...................................................................
5
Figure 3-1
When viewed electronically, the rounded rectangles are buttons which generate mouse-over popup text
boxes
. .........................................................................................................................................................
8
Figure 3-2
The HP Blade Workstation Solution architecture
................................................................................
9
Figure 3-3
iLO 2 status summary
..................................................................................................................
11
Figure 3-4
Boot console
..............................................................................................................................
12
Figure 3-5
Connecting virtual media to the blade workstation
..........................................................................
12
Figure 3-6
c7000 enclosure front and rear views provided by Onboard Administrator
.......................................
18
Figure 4-1
Recommended blade workstation solution deployment steps
.............................................................
20
Figure 5-1
The RGS performance triad
..........................................................................................................
23
Figure 5-2
Network traffic between the RGS Sender and Receiver
....................................................................
24
Figure 5-3
Separation of RGS traffic from data traffic
.....................................................................................
26
Figure 5-4
Maximizing RGS security
............................................................................................................
28
Figure 5-5
Maximizing RGS reliability
..........................................................................................................
29
Figure 5-6
Typical network layers in an enterprise-class network
......................................................................
30
Figure 5-7
Latency and bandwidth consumption
.............................................................................................
31
Figure 5-8
Bing command sample output
......................................................................................................
32
Figure 5-9
Ethereal sample screen
................................................................................................................
33
Figure 5-10
Performance monitoring
............................................................................................................
34
Tables
Table 5-1
RGS frame rate for different network latencies when
Rgreceiver.MaxImageUpdateRequests=1
....
24
Table 5-2
Latency values and their effects
......................................................................................................
25
Table 5-3
Typical bandwidth consumption for a 100 Mb/s network
.................................................................
34