Garmin GPSMAP 527 Owner's Manual - Page 65
Understanding the Depth Log Screen, Sonar, Temp Log
 |
View all Garmin GPSMAP 527 manuals
Add to My Manuals
Save this manual to your list of manuals |
Page 65 highlights
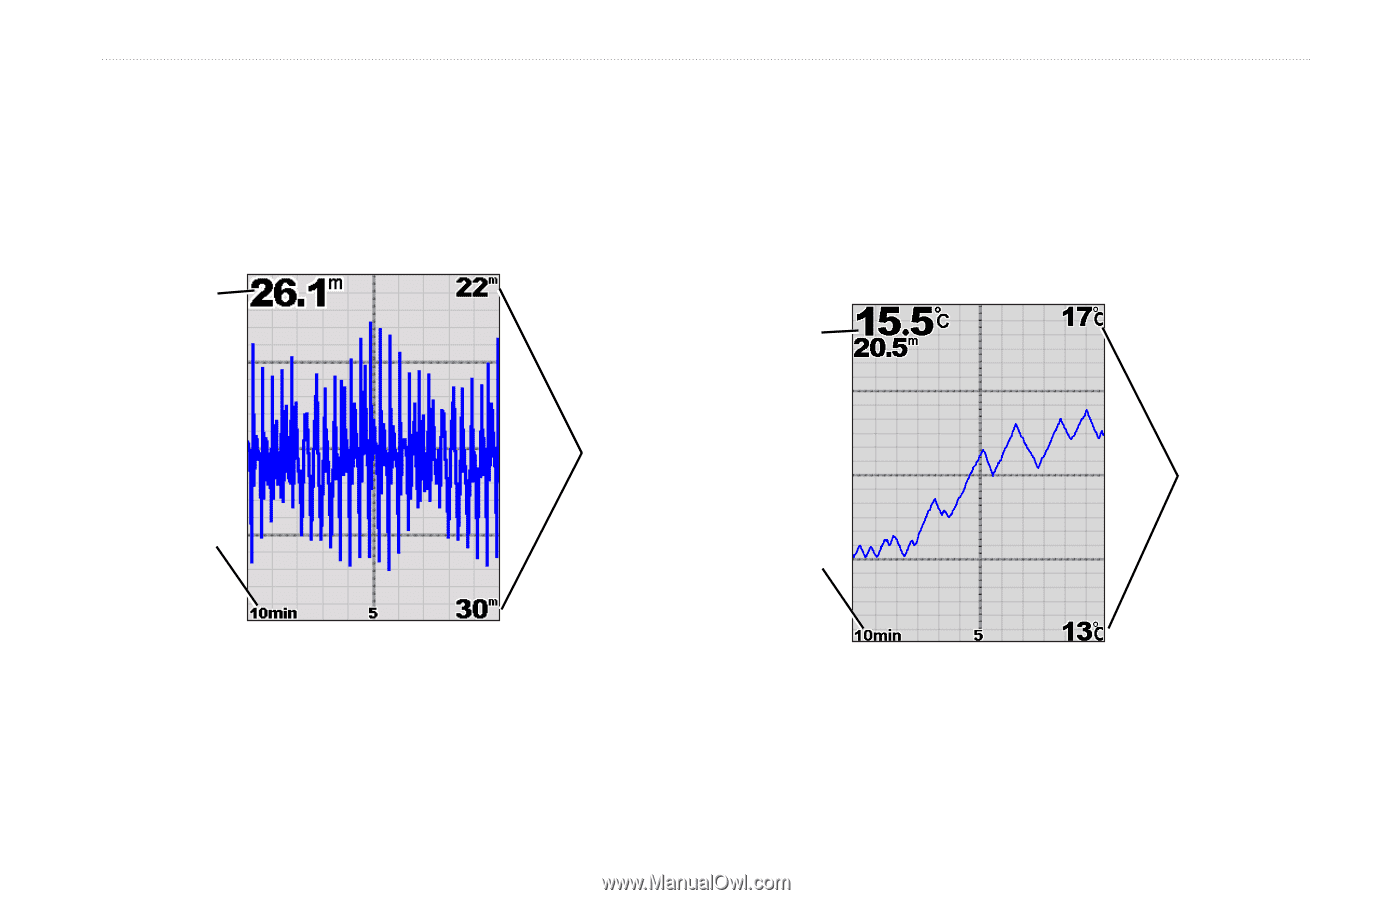
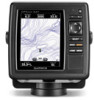
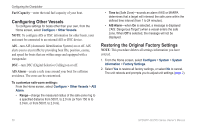
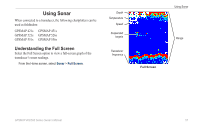
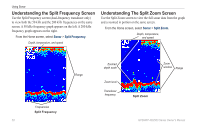
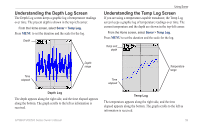
Understanding the Depth Log Screen The Depth Log screen keeps a graphic log of temperature readings over time. The present depth is shown in the top-left corner. From the Home screen, select Sonar > Temp Log. Press MENU to set the duration and the scale for the log. Depth Using Sonar Understanding the Temp Log Screen If you are using a temperature-capable transducer, the Temp Log screen keeps a graphic log of temperature readings over time. The current temperature and the depth are shown in the top-left corner. From the Home screen, select Sonar > Temp Log. Press MENU to set the duration and the scale for the log. Temp and depth Time elapsed Depth range Time elapsed Temperature range Depth Log The depth appears along the right side, and the time elapsed appears along the bottom. The graph scrolls to the left as information is received. Temp Log The temperature appears along the right side, and the time elapsed appears along the bottom. The graph scrolls to the left as information is received. GPSMAP 400/500 Series Owner's Manual 59
-
 1
1 -
2
-
3
-
4
-
5
-
6
-
7
-
8
-
9
-
10
-
11
-
12
-
13
-
14
-
15
-
16
-
17
-
18
-
19
-
20
-
21
-
22
-
23
-
24
-
25
-
26
-
27
-
28
-
29
-
30
-
31
-
32
-
33
-
34
-
35
-
36
-
37
-
38
-
39
-
40
-
41
-
42
-
43
-
44
-
45
-
46
-
47
-
48
-
49
-
50
-
51
-
52
-
53
-
54
-
55
-
56
-
57
-
58
-
59
-
 60
60 -
 61
61 -
 62
62 -
 63
63 -
 64
64 -
 65
65 -
 66
66 -
 67
67 -
 68
68 -
 69
69 -
 70
70 -
71
-
72
-
73
-
74
-
75
-
76
-
77
-
78
-
79
-
80
-
81
-
82
-
83
-
84
 |
 |