Netgear WNR1000v3 User Manual - Page 99
Show Statistics, Poll Interval, Set Interval, Table 6-3. Router Statistics - update
 |
View all Netgear WNR1000v3 manuals
Add to My Manuals
Save this manual to your list of manuals |
Page 99 highlights
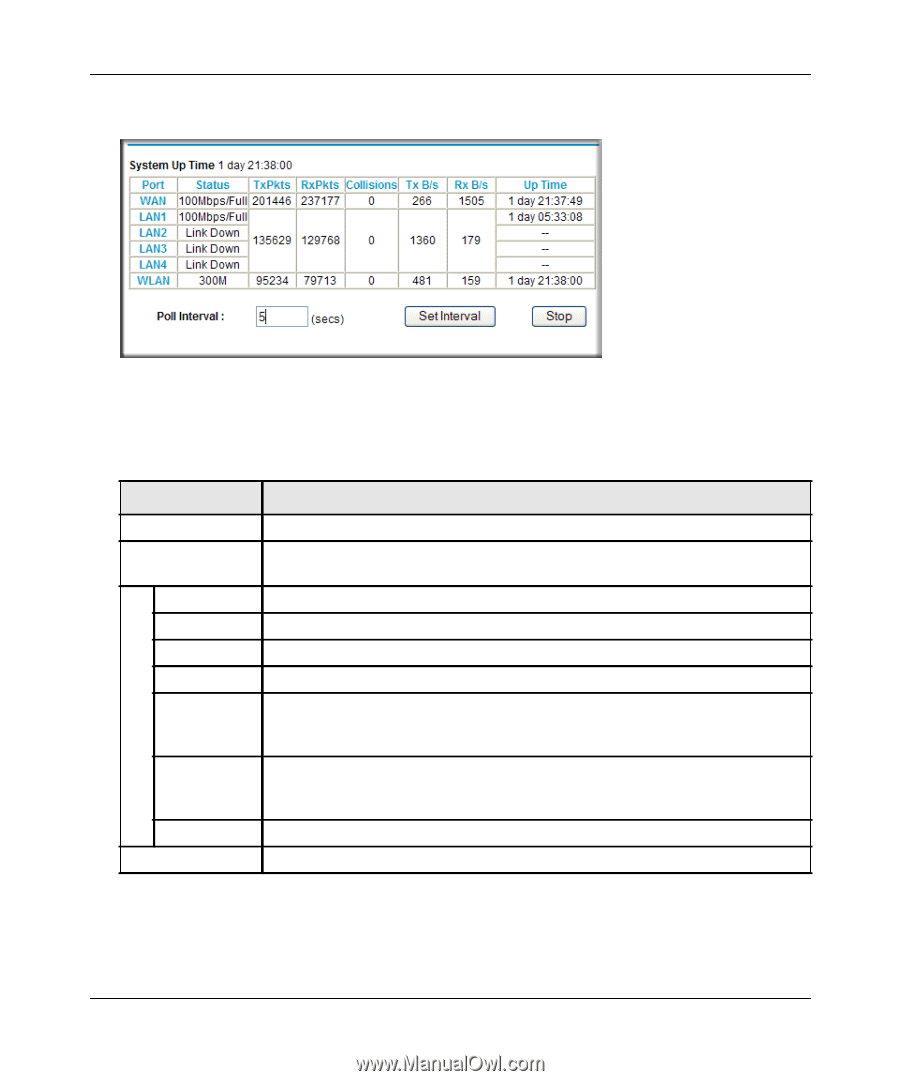
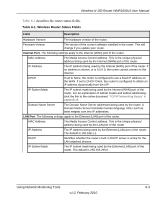
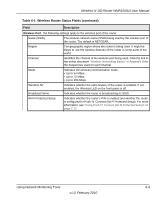
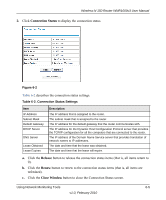
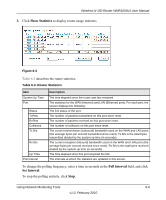
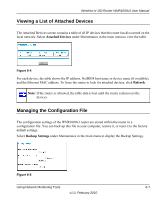
Wireless-N 150 Router WNR1000v3 User Manual 3. Click Show Statistics to display router usage statistics. Figure 6-3 Table 6-3 describes the router statistics. Table 6-3. Router Statistics Item System Up Time Port Status TxPkts RxPkts Collisions Tx B/s Rx B/s Up Time Poll Interval Description The time elapsed since the router was last restarted. The statistics for the WAN (Internet) and LAN (Ethernet) ports. For each port, the screen displays the following: The link status of the port. The number of packets transmitted on this port since reset. The number of packets received on this port since reset. The number of collisions on this port since reset. The current transmission (outbound) bandwidth used on the WAN and LAN ports (the average bytes per second transmitted since reset). Tx B/s is the total bytes transmitted divided by the system up time (in seconds). The current reception (inbound) bandwidth used on the WAN and LAN ports (the average bytes per second received since reset). Rx B/s is the total bytes received divided by the system up time (in seconds). The time elapsed since this port acquired the link. The intervals at which the statistics are updated in this screen. To change the polling frequency, enter a time in seconds in the Poll Interval field, and click Set Interval. To stop the polling entirely, click Stop. Using Network Monitoring Tools 6-6 v1.0, February 2010
-
 1
1 -
2
-
3
-
4
-
5
-
6
-
7
-
8
-
9
-
10
-
11
-
12
-
13
-
14
-
15
-
16
-
17
-
18
-
19
-
20
-
21
-
22
-
23
-
24
-
25
-
26
-
27
-
28
-
29
-
30
-
31
-
32
-
33
-
34
-
35
-
36
-
37
-
38
-
39
-
40
-
41
-
42
-
43
-
44
-
45
-
46
-
47
-
48
-
49
-
50
-
51
-
52
-
53
-
54
-
55
-
56
-
57
-
58
-
59
-
60
-
61
-
62
-
63
-
64
-
65
-
66
-
67
-
68
-
69
-
70
-
71
-
72
-
73
-
74
-
75
-
76
-
77
-
78
-
79
-
80
-
81
-
82
-
83
-
84
-
85
-
86
-
87
-
88
-
89
-
90
-
91
-
92
-
93
-
 94
94 -
 95
95 -
 96
96 -
 97
97 -
 98
98 -
 99
99 -
 100
100 -
 101
101 -
 102
102 -
 103
103 -
 104
104 -
105
-
106
-
107
-
108
-
109
-
110
-
111
-
112
-
113
-
114
-
115
-
116
-
117
-
118
-
119
-
120
-
121
-
122
-
123
-
124
-
125
-
126
-
127
-
128
-
129
-
130
 |
 |