Canon CanoScan D1250U2F CanoScan D1250U2 ScanGear CS-U 6.3 for Win Guide - Page 41
Editing a Special Tone Curve Directly, Here are some hints for editing curves
 |
View all Canon CanoScan D1250U2F manuals
Add to My Manuals
Save this manual to your list of manuals |
Page 41 highlights
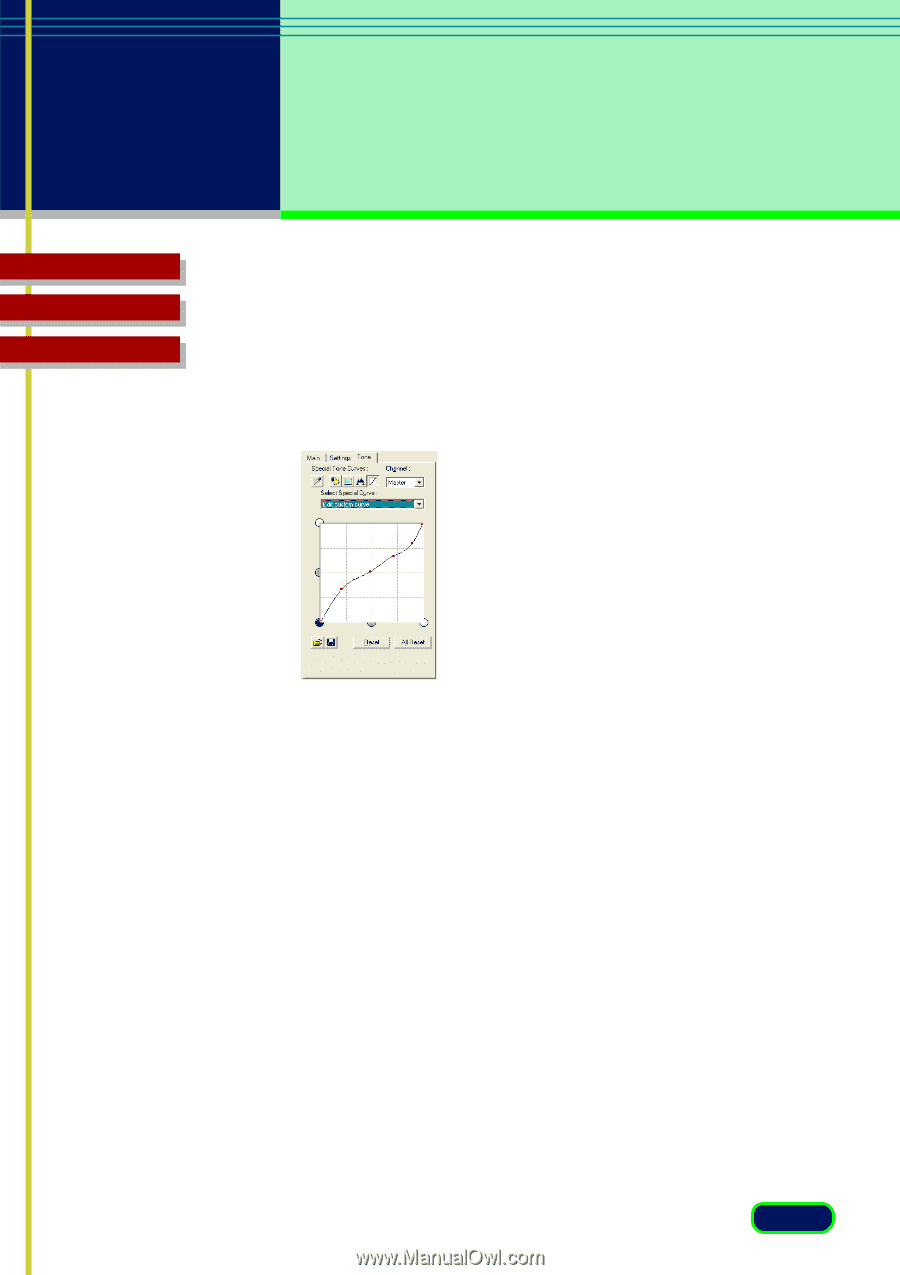
chapter 3 What is on the screen? Contents Glossary Index Editing a Special Tone Curve Directly In the Special Tone Curves graph you can edit the curve directly. Click on the curve and drag each curve anchor point until the desired effect is achieved. To remove an anchor point, drag the anchor point off the graph area, or right click the anchor point. Here are some hints for editing curves: • Curve handles are drawn on a white background as a red dot to signify that they are editable. When the cursor is over the handle, it changes to a crosshair. • Curve end points can be selected and dragged to any point in the curve but cannot be deleted. • Up to 15 points can be added to a curve by clicking anywhere in the curve box. • If you drag a point outside of a curve box, it will be deleted from the curve and a new curve will form with the remaining points. • The x and y axes on the curve chart represent the input image color and output image color. When you add a handle to the curve and drag that handle toward the white areas, the preview image tones are adjusted to reflect the change. • More than one handle cannot be positioned on a vertical line but more than one handle can be positioned on a horizontal line so you can have several handles on a horizontal line. 41
-
 1
1 -
2
-
3
-
4
-
5
-
6
-
7
-
8
-
9
-
10
-
11
-
12
-
13
-
14
-
15
-
16
-
17
-
18
-
19
-
20
-
21
-
22
-
23
-
24
-
25
-
26
-
27
-
28
-
29
-
30
-
31
-
32
-
33
-
34
-
35
-
 36
36 -
 37
37 -
 38
38 -
 39
39 -
 40
40 -
 41
41 -
 42
42 -
 43
43 -
 44
44 -
 45
45 -
 46
46 -
47
-
48
-
49
-
50
-
51
-
52
-
53
-
54
-
55
-
56
-
57
-
58
-
59
-
60
-
61
-
62
-
63
-
64
-
65
-
66
-
67
-
68
-
69
 |
 |