McAfee MSA09EMB1RAA Product Guide - Page 43
Using Dashboards, Monitors, and Reports, Use queries to create reports
 |
UPC - 731944578675
View all McAfee MSA09EMB1RAA manuals
Add to My Manuals
Save this manual to your list of manuals |
Page 43 highlights
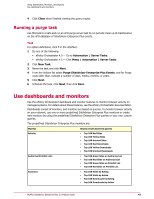
Using Dashboards, Monitors, and Reports To monitor browser protection and security, use the ePolicy Orchestrator dashboard, monitor, and query features. SiteAdvisor Enterprise Plus provides a number of predefined queries and monitors that create reports on the sites and download files which users access or attempt to access. After running queries and reports over an extended period of time, it is good practice to purge the the ePO database of SiteAdvisor Enterprise Plus data to ensure proper generation of queries and reports. This occasional database maintenance is done by running an ePO purge server task. Contents Use queries to create reports Use dashboards and monitors Use queries to create reports Use SiteAdvisor Enterprise Plus queries to obtain reports about browsing activity on managed systems. Choose from a variety of predefined McAfee queries, or create your own by using the ePO Query Builder. You can use a predefined query as the basis for a customized query or create a brand new query. See Querying the Database in the ePolicy Orchestrator Product Guide for more information. Access queries by going to the Queries pane under Reporting. All predefined SiteAdvisor Enterprise Plus queries begin with SAE+, followed by a descriptive name. You can use queries as the basis for dashboard monitors, or you can run them separately. The predefined SiteAdvisor Enterprise Plus queries are: Query Name Download Log Downloads by Action Downloads by Rating Functional Compliance Top 100 Blocked Red Sites Top 100 Blocked Sites Description Detailed event log listing all downloads over the last 30 days. Bar chart depicting the number of downloads over the last 30 days, grouped by policy-based action. Pie chart depicting the number of downloads over the last 30 days, grouped by file rating. Pie chart depicting the number of managed systems where the SiteAdvisor Enterprise Plus client software is installed and able to function correctly. List of 100 blocked red sites that users attempted to visit most frequently. List of 100 blocked sites that users attempted to visit most frequently. McAfee SiteAdvisor Enterprise Plus 3.0 Product Guide 43
-
 1
1 -
2
-
3
-
4
-
5
-
6
-
7
-
8
-
9
-
10
-
11
-
12
-
13
-
14
-
15
-
16
-
17
-
18
-
19
-
20
-
21
-
22
-
23
-
24
-
25
-
26
-
27
-
28
-
29
-
30
-
31
-
32
-
33
-
34
-
35
-
36
-
37
-
 38
38 -
 39
39 -
 40
40 -
 41
41 -
 42
42 -
 43
43 -
 44
44 -
 45
45 -
 46
46 -
 47
47 -
 48
48 -
49
-
50
-
51
-
52
-
53
-
54
-
55
-
56
-
57
-
58
 |
 |
