McAfee MSA09EMB1RAA Product Guide - Page 46
Creating monitors, Dashboards, Menu | Reporting | Dashboards, Options, New Dashboard, New Monitor
 |
UPC - 731944578675
View all McAfee MSA09EMB1RAA manuals
Add to My Manuals
Save this manual to your list of manuals |
Page 46 highlights
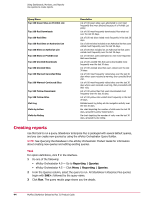
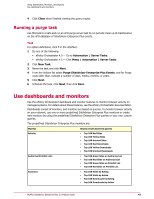
Using Dashboards, Monitors, and Reports Use dashboards and monitors Monitor Warned/Blocked Shows results for these queries • Top 100 Blocked Sites • Top 100 Blocked Red Sites • Top 100 Warned-Cancelled Sites • Top 100 Warned-Continued Sites Creating monitors Use this task to create a monitor that reports browser activity on managed systems. Monitors appear in tabs on the Dashboards page. Task For option definitions, click ? in the interface. 1 Do one of the following: • ePolicy Orchestrator 4.0 - Go to Dashboards. • ePolicy Orchestrator 4.5 - Click Menu | Reporting | Dashboards. 2 Select Options, then New Dashboard. 3 In the Name field, type a descriptive name. 4 From the Size list, select a dashboard layout. 5 For each dashboard panel, click New Monitor. 6 For the Category option, select Queries. 7 For the Monitor option, select a query from the drop-down list. All SiteAdvisor Enterprise Plus queries begin with SAE+:. 8 Click OK. 9 Repeat steps 5-8 to add monitors, then click Save. 10 In the Make Active dialog box, click Yes. You can add only active dashboards to the Dashboard page. 11 In the Manage Dashboards page, click Close. 46 McAfee SiteAdvisor Enterprise Plus 3.0 Product Guide
-
 1
1 -
2
-
3
-
4
-
5
-
6
-
7
-
8
-
9
-
10
-
11
-
12
-
13
-
14
-
15
-
16
-
17
-
18
-
19
-
20
-
21
-
22
-
23
-
24
-
25
-
26
-
27
-
28
-
29
-
30
-
31
-
32
-
33
-
34
-
35
-
36
-
37
-
38
-
39
-
40
-
 41
41 -
 42
42 -
 43
43 -
 44
44 -
 45
45 -
 46
46 -
 47
47 -
 48
48 -
 49
49 -
 50
50 -
 51
51 -
52
-
53
-
54
-
55
-
56
-
57
-
58
 |
 |
