HP GbE2c HP GbE2c Ethernet Blade Switch for c-Class BladeSystem Command Refere - Page 61
Statistics Menu, Introduction, Menu information, Statistics Menu options - l2 l3 commands
 |
UPC - 808736802215
View all HP GbE2c manuals
Add to My Manuals
Save this manual to your list of manuals |
Page 61 highlights
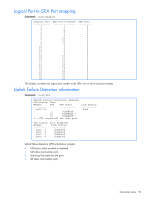
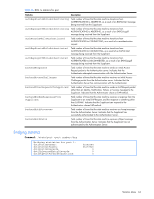
Statistics Menu Introduction You can view switch performance statistics in the user, operator, and administrator command modes. This chapter discusses how to use the CLI to display switch statistics. Menu information Command: /stats [Statistics Menu] port - Port Stats Menu l2 - Layer 2 Stats Menu l3 - Layer 3 Stats Menu mp - MP-specific Stats Menu acl - ACL Stats Menu snmp - Show SNMP stats ntp - Show NTP stats ufd - Show Uplink Failure Detection stats clrmp - Clear all MP related stats dump - Dump all stats The following table describes the Statistics Menu options. Table 44 Statistics Menu options Command Usage port l2 l3 mp acl snmp ntp ufd clrmp dump Displays the Port Statistics Menu for the specified port. Use this command to display traffic statistics on a port-by-port basis. Traffic statistics are included in SNMP Management Information Base (MIB) objects. Displays the Layer 2 Statistics Menu. Displays the Layer 3 Statistics Menu. Displays the Management Processor Statistics Menu. Use this command to view information on how switch management processes and resources are currently being allocated. Displays the Access Control List Statistics Menu. Displays SNMP statistics. Displays Network Time Protocol (NTP) Statistics. You can execute the clear command option to delete all statistics. Displays Uplink Failure Detection statistics. Add the argument, clear, to clear UFD statistics. Clears all Management Processor statistics. Dumps all switch statistics. Use this command to gather data for tuning and debugging switch performance. If you want to capture dump data to a file, set your communication software on your workstation to capture session data prior to issuing the dump command. Statistics Menu 61
-
 1
1 -
2
-
3
-
4
-
5
-
6
-
7
-
8
-
9
-
10
-
11
-
12
-
13
-
14
-
15
-
16
-
17
-
18
-
19
-
20
-
21
-
22
-
23
-
24
-
25
-
26
-
27
-
28
-
29
-
30
-
31
-
32
-
33
-
34
-
35
-
36
-
37
-
38
-
39
-
40
-
41
-
42
-
43
-
44
-
45
-
46
-
47
-
48
-
49
-
50
-
51
-
52
-
53
-
54
-
55
-
 56
56 -
 57
57 -
 58
58 -
 59
59 -
 60
60 -
 61
61 -
 62
62 -
 63
63 -
 64
64 -
 65
65 -
 66
66 -
67
-
68
-
69
-
70
-
71
-
72
-
73
-
74
-
75
-
76
-
77
-
78
-
79
-
80
-
81
-
82
-
83
-
84
-
85
-
86
-
87
-
88
-
89
-
90
-
91
-
92
-
93
-
94
-
95
-
96
-
97
-
98
-
99
-
100
-
101
-
102
-
103
-
104
-
105
-
106
-
107
-
108
-
109
-
110
-
111
-
112
-
113
-
114
-
115
-
116
-
117
-
118
-
119
-
120
-
121
-
122
-
123
-
124
-
125
-
126
-
127
-
128
-
129
-
130
-
131
-
132
-
133
-
134
-
135
-
136
-
137
-
138
-
139
-
140
-
141
-
142
-
143
-
144
-
145
-
146
-
147
-
148
-
149
-
150
-
151
-
152
-
153
-
154
-
155
-
156
-
157
-
158
-
159
-
160
-
161
-
162
-
163
-
164
-
165
-
166
-
167
-
168
-
169
-
170
-
171
-
172
-
173
-
174
-
175
 |
 |
